

Fashion conglomerate Oxford Industries (NYSE: OXM) reported Q4 CY2025 results exceeding the market’s revenue expectations, but sales fell by 4.1% year on year to $374.5 million. On the other hand, next quarter’s revenue guidance of $390 million was less impressive, coming in 0.6% below analysts’ estimates. Its non-GAAP loss of $0.09 per share was significantly below analysts’ consensus estimates.
Is now the time to buy Oxford Industries? Find out by accessing our full research report, it’s free.
Oxford Industries (OXM) Q4 CY2025 Highlights:
- Revenue: $374.5 million vs analyst estimates of $371.8 million (4.1% year-on-year decline, 0.7% beat)
- Adjusted EPS: -$0.09 vs analyst estimates of $0.03 (significant miss)
- Adjusted EBITDA: $8.1 million vs analyst estimates of $17.6 million (2.2% margin, 54% miss)
- Revenue Guidance for Q1 CY2026 is $390 million at the midpoint, below analyst estimates of $392.5 million
- Adjusted EPS guidance for the upcoming financial year 2026 is $2.40 at the midpoint, missing analyst estimates by 8.9%
- Operating Margin: -2.1%, down from 5.2% in the same quarter last year
- Free Cash Flow Margin: 9.2%, down from 12.4% in the same quarter last year
- Market Capitalization: $490.5 million
Tom Chubb, Chairman and CEO, commented, “Momentum in our largest business, Tommy Bahama, improved as the quarter progressed, with trends strengthening beginning in late January. This momentum helped us deliver fourth quarter net sales and adjusted earnings per share within our guidance ranges, excluding charges associated with the bankruptcy of Saks Global, against the backdrop of an uneven consumer environment. While traffic and conversion trends were pressured across much of our portfolio during the holiday season, and higher tariffs increased our costs, the strategic actions we took to strengthen our supply chain and diversify our sourcing allowed us to protect our strong gross margins. We also adjusted our merchandise assortments to better match customer expectations, important actions that helped return overall comparable sales to positive territory as fiscal 2025 concluded.”
Company Overview
The parent company of Tommy Bahama, Oxford Industries (NYSE: OXM) is a lifestyle fashion conglomerate with brands that embody outdoor happiness.
Revenue Growth
A company’s long-term sales performance can indicate its overall quality. Any business can put up a good quarter or two, but the best consistently grow over the long haul. Over the last five years, Oxford Industries grew its sales at a 14.6% annual rate. Though this growth is acceptable on an absolute basis, we need to see more than just topline growth for the consumer discretionary sector, which can display significant earnings volatility. This means our bar for the sector is particularly high, reflecting the non-essential and hit-driven nature of the products and services offered. Additionally, five-year CAGR starts around Covid, when revenue was depressed then rebounded.
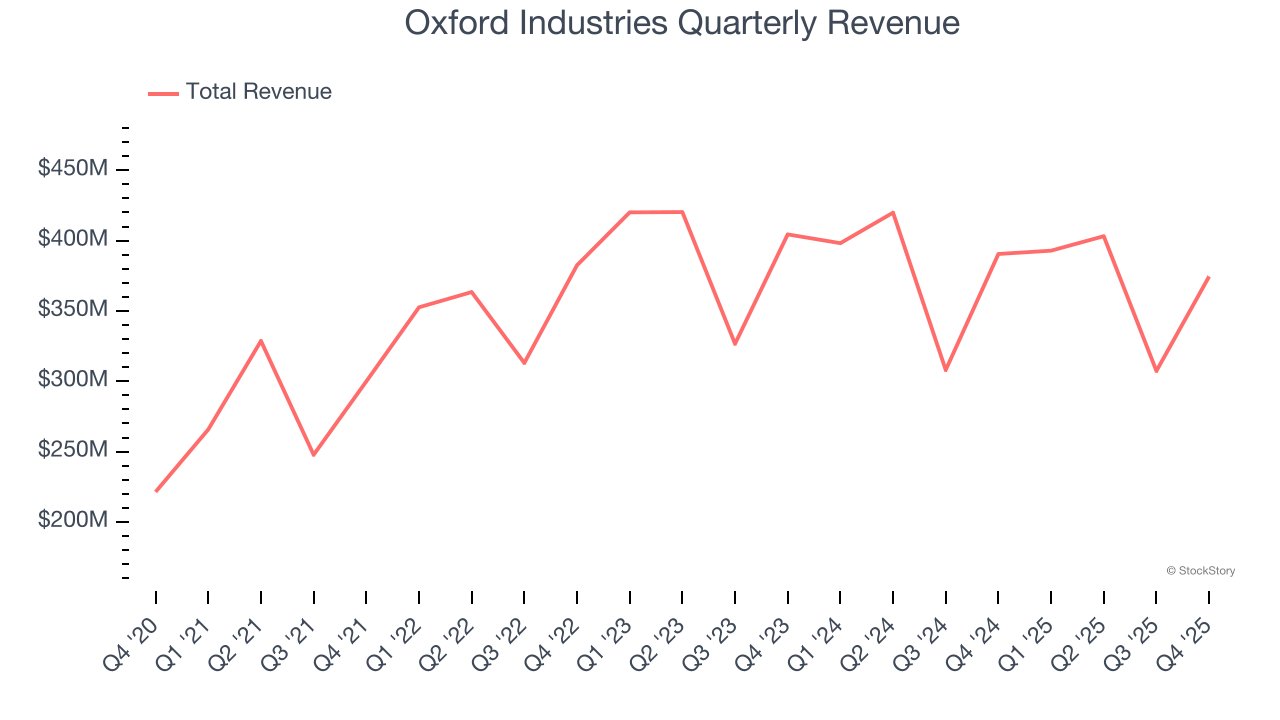
We at StockStory place the most emphasis on long-term growth, but within consumer discretionary, a stretched historical view may miss a company riding a successful new product or trend. Oxford Industries’s performance shows it grew in the past but relinquished its gains over the last two years, as its revenue fell by 3% annually. 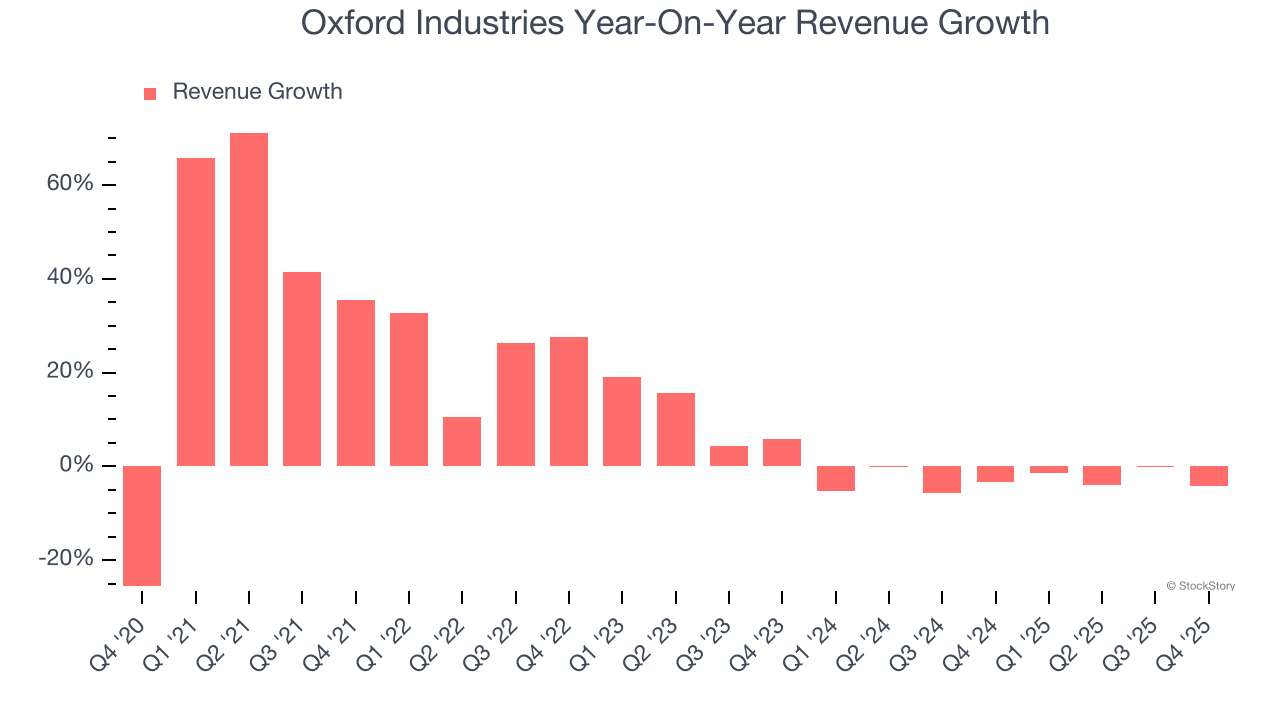
This quarter, Oxford Industries’s revenue fell by 4.1% year on year to $374.5 million but beat Wall Street’s estimates by 0.7%. Company management is currently guiding for flat sales next quarter.
Looking further ahead, sell-side analysts expect revenue to grow 1.5% over the next 12 months. While this projection implies its newer products and services will spur better top-line performance, it is still below the sector average.
WHILE YOU’RE HERE: The Next Palantir? One satellite company captures images of every point on Earth. Every single day. The Pentagon wants it. Hedge funds are using it to beat earnings. You’ve probably never heard of it.
This is what the early days of Palantir looked like before it became a $437 billion giant. Same playbook. Different technology. If you missed Palantir, you need to see this. Claim The Stock Ticker for Free HERE.
Operating Margin
Operating margin is an important measure of profitability as it shows the portion of revenue left after accounting for all core expenses – everything from the cost of goods sold to advertising and wages. It’s also useful for comparing profitability across companies with different levels of debt and tax rates because it excludes interest and taxes.
Oxford Industries’s operating margin has shrunk over the last 12 months and averaged 2.9% over the last two years. The company’s profitability was mediocre for a consumer discretionary business and shows it couldn’t pass its higher operating expenses onto its customers.
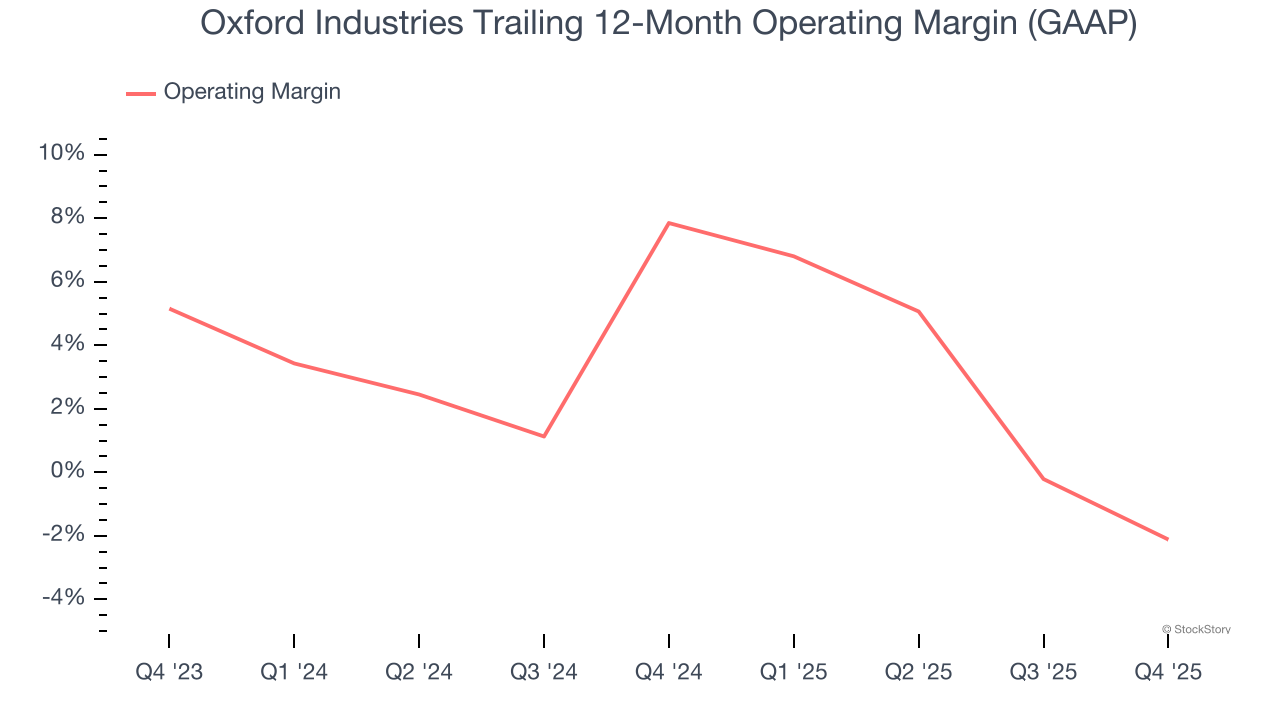
In Q4, Oxford Industries generated an operating margin profit margin of negative 2.1%, down 7.3 percentage points year on year. This contraction shows it was less efficient because its expenses increased relative to its revenue.
Earnings Per Share
We track the long-term change in earnings per share (EPS) for the same reason as long-term revenue growth. Compared to revenue, however, EPS highlights whether a company’s growth is profitable.
Oxford Industries’s full-year EPS flipped from negative to positive over the last five years. This is encouraging and shows it’s at a critical moment in its life.
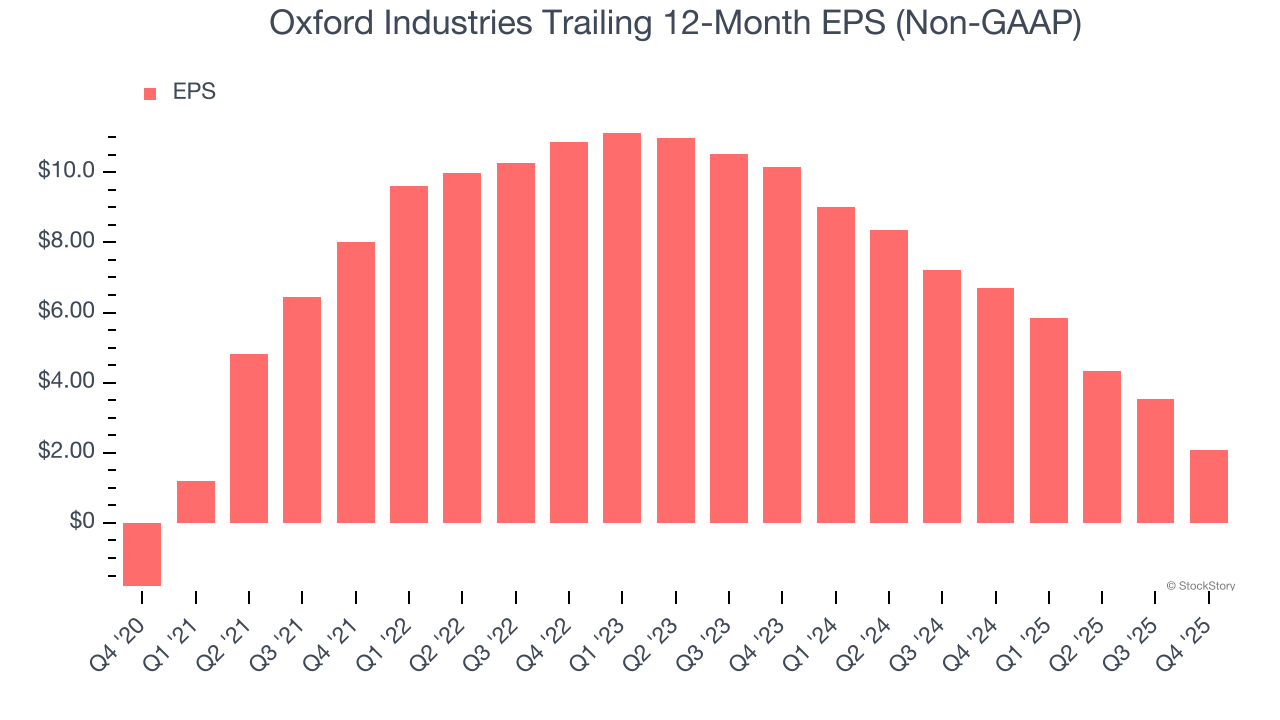
In Q4, Oxford Industries reported adjusted EPS of negative $0.09, down from $1.37 in the same quarter last year. This print missed analysts’ estimates. Over the next 12 months, Wall Street expects Oxford Industries’s full-year EPS of $2.07 to grow 41.3%.
Key Takeaways from Oxford Industries’s Q4 Results
We struggled to find many positives in these results. Its EBITDA missed and its EPS fell short of Wall Street’s estimates. Overall, this was a softer quarter. The stock traded down 2.7% to $31.04 immediately after reporting.
Oxford Industries underperformed this quarter, but does that create an opportunity to invest right now? The latest quarter does matter, but not nearly as much as longer-term fundamentals and valuation, when deciding if the stock is a buy. We cover that in our actionable full research report which you can read here (it’s free).


