
TFS Financial’s 25.9% return over the past six months has outpaced the S&P 500 by 17.5%, and its stock price has climbed to $18.30 per share. This run-up might have investors contemplating their next move.
Is now the time to buy TFS Financial, or should you be careful about including it in your portfolio? Check out our in-depth research report to see what our analysts have to say, it’s free.
Why Do We Think TFS Financial Will Underperform?
We’re glad investors have benefited from the price increase, but we don’t have much confidence in TFS Financial. Here are three reasons you should be careful with TFSL, plus one stock we’d rather own.
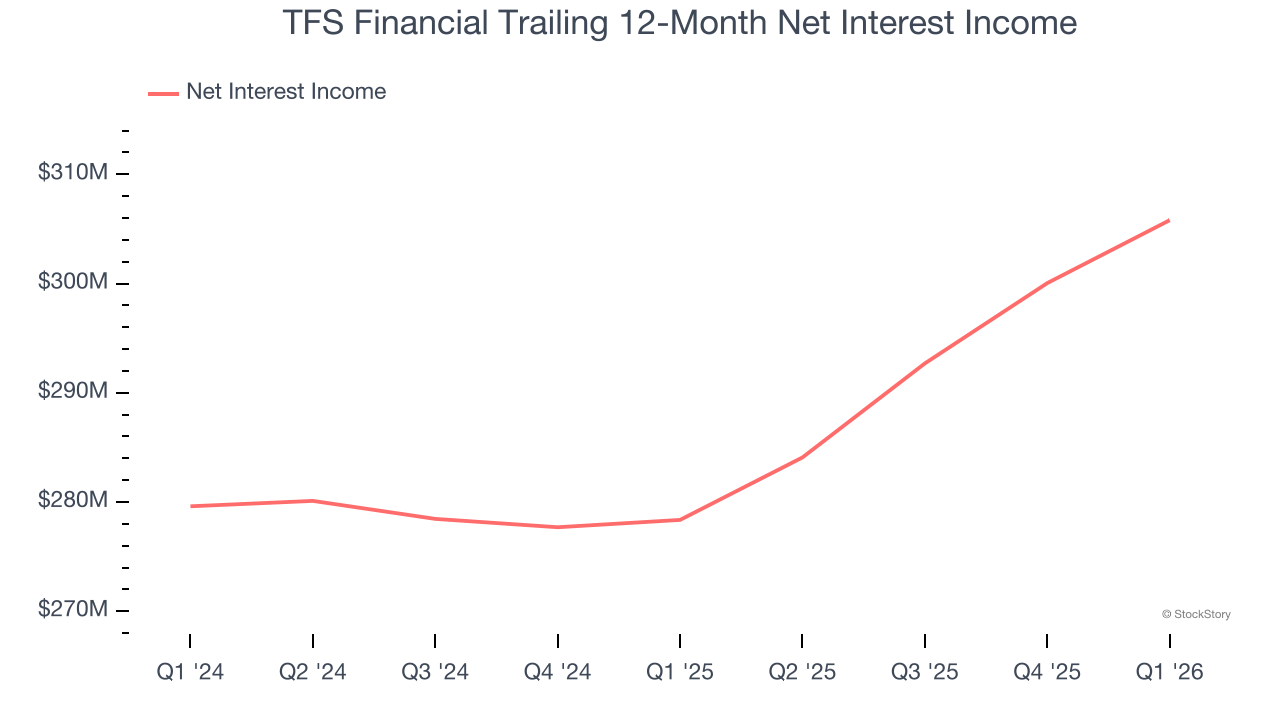
1. Net Interest Income Points to Soft Demand
Net interest income commands greater market attention due to its reliability and consistency, whereas one-time fees are often seen as lower-quality revenue that lacks the same dependable characteristics.
TFS Financial’s net interest income has grown at a 5.8% annualized rate over the last five years, worse than the broader banking industry. Its growth was driven by both an increase in its outstanding loans and net interest margin, which represents how much a bank earns in relation to its outstanding loan book.
2. Low Net Interest Margin Reveals Weak Loan Book Profitability
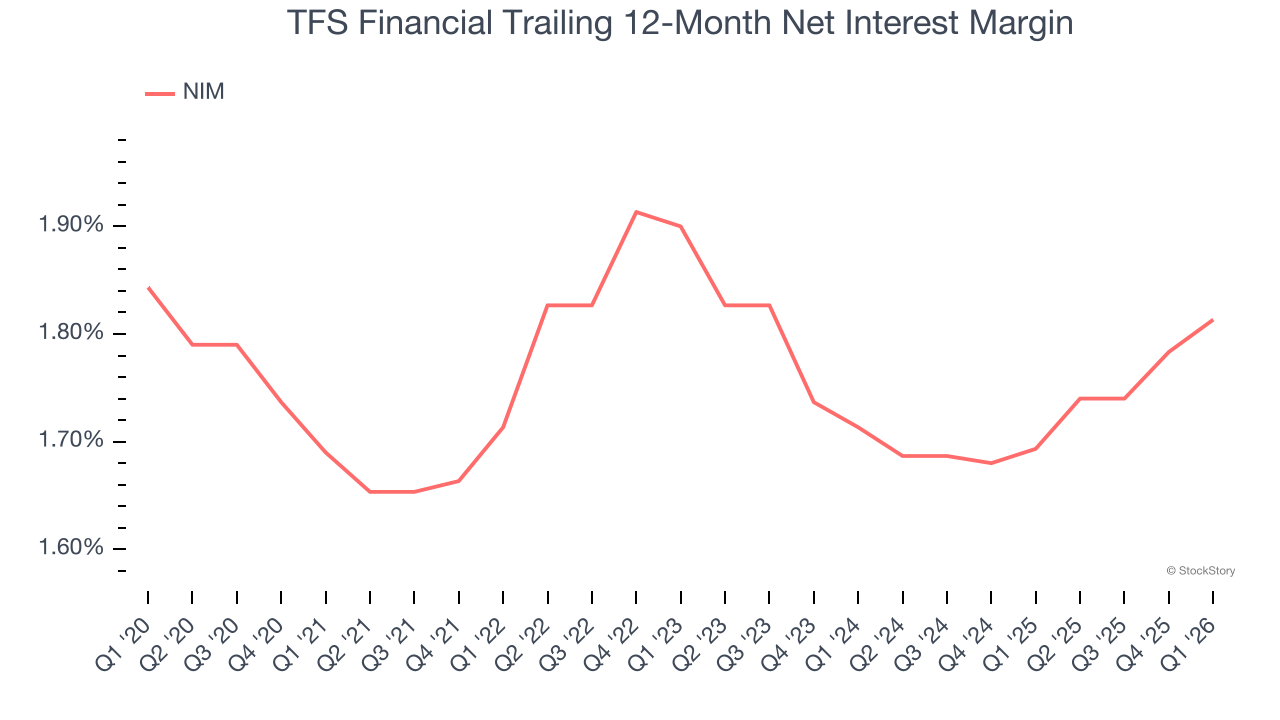
Net interest margin (NIM) represents how much a bank earns in relation to its outstanding loans. It’s one of the most important metrics to track because it shows how a bank’s loans are performing and whether it has the ability to command higher premiums for its services.
Over the past two years, we can see that TFS Financial’s net interest margin averaged a poor 1.8%, indicating the company has weak loan book economics.
3. EPS Growth Has Stalled
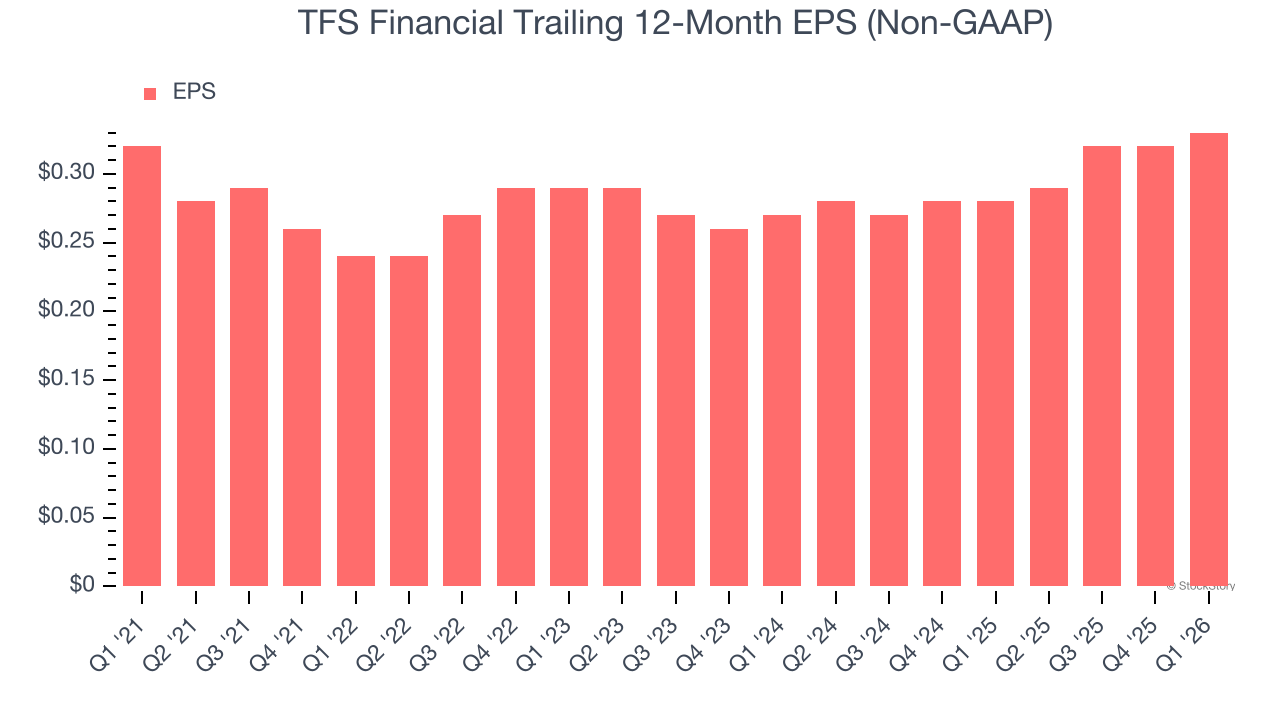
We track the long-term change in earnings per share (EPS) because it highlights whether a company’s growth is profitable.
TFS Financial’s flat EPS over the last five years was below its 1.8% annualized revenue growth. This tells us the company became less profitable on a per-share basis as it expanded.
Final Judgment
We cheer for all companies supporting the economy, but in the case of TFS Financial, we’ll be cheering from the sidelines. With its shares beating the market recently, the stock trades at 2.6× forward P/B (or $18.30 per share). At this valuation, there’s a lot of good news priced in - we think other companies feature superior fundamentals at the moment. Let us point you toward the most dominant software business in the world.
Stocks We Like More Than TFS Financial
ALSO WORTH WATCHING: Top 5 Momentum Stocks. The best time to own a great stock is when the market is finally noticing it. These aren’t just high-quality businesses. Something is happening with them right now. Elite fundamentals meet near-term momentum — both boxes checked at the same time.
Find out which stocks our AI platform is flagging this week. See this week’s Strong Momentum stocks — FREE. Get Our Strong Momentum Stocks for Free HERE.
Stocks that have made our list include now familiar names such as Nvidia (+1,460% between June 2020 and June 2025) as well as under-the-radar businesses like the once-micro-cap company Kadant (+214% between June 2020 and June 2025). Find your next big winner with StockStory today.