Reports 27% YoY ACV Billings Growth and Achieves Positive Non-GAAP Operating Income
Delivers Outperformance Across All Guided Metrics
Nutanix, Inc. (NASDAQ: NTNX), a leader in hybrid multicloud computing, today announced financial results for its first quarter ended October 31, 2022.
This press release features multimedia. View the full release here: https://www.businesswire.com/news/home/20221130005395/en/
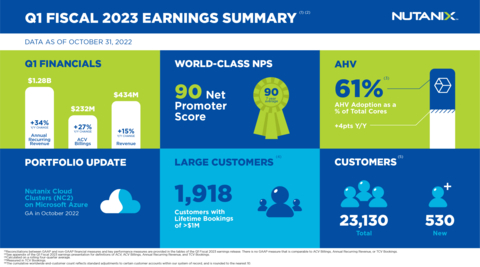
Nutanix Q1 Fiscal 2023 Earnings Summary (Graphic: Business Wire)
“We delivered a solid first quarter financial performance against an uncertain macro backdrop, reflecting the value our customers see in the Nutanix Cloud Platform and the strength of our subscription-based business model,” said Rajiv Ramaswami, President and CEO of Nutanix. “We also made important progress towards realizing our hybrid multicloud vision with the general availability of Nutanix Cloud Clusters (NC2) on Microsoft Azure and enhancements to our platform to accelerate the adoption of Kubernetes at scale in the enterprise.”
“Our first quarter results reflect continued progress on our subscription-based business model with 27% year-over-year ACV billings growth and achievement of positive quarterly non-GAAP operating income for the first time,” said Rukmini Sivaraman, CFO of Nutanix. “We continue to see good execution on our building base of subscription renewals and remain focused on driving towards sustainable, profitable growth.”
First Quarter Fiscal 2023 Financial Summary
|
Q1 FY’23 |
|
Q1 FY’22 |
|
Y/Y Change |
|
Annual Contract Value (ACV)1 Billings |
$231.9 million |
|
$183.3 million |
|
27% |
|
Annual Recurring Revenue (ARR)2 |
$1.28 billion |
|
$952.6 million |
|
34% |
|
Average Contract Term3 |
3.0 years |
|
3.1 years |
|
(0.1) year |
|
Revenue4 |
$433.6 million |
|
$378.5 million |
|
15% |
|
GAAP Gross Margin |
81.0% |
|
78.5% |
|
250 bps |
|
Non-GAAP Gross Margin |
83.4% |
|
82.1% |
|
130 bps |
|
GAAP Operating Expenses |
$431.4 million |
|
$434.3 million |
|
(1)% |
|
Non-GAAP Operating Expenses |
$351.1 million |
|
$352.6 million |
|
(0.4)% |
|
GAAP Operating Loss |
$(80.3) million |
|
$(137.3) million |
|
42% |
|
Non-GAAP Operating Income (Loss) |
$10.6 million |
|
$(41.9) million |
|
$52.5 million |
|
GAAP Operating Margin |
(18.5)% |
|
(36.3)% |
|
17.8 % pts |
|
Non-GAAP Operating Margin |
2.4% |
|
(11.1)% |
|
13.5 % pts |
|
Free Cash Flow |
$45.8 million |
|
$(1.9) million |
|
$47.7 million |
Reconciliations between GAAP and non-GAAP financial measures and key performance measures, to the extent available, are provided in the tables of this press release.
Recent Company Highlights
- Launched Nutanix Cloud Clusters (NC2) on Microsoft Azure: Nutanix announced the general availability of NC2 on Microsoft Azure, extending its hybrid cloud environment to Microsoft Azure dedicated bare metal nodes.
- Nutanix Named a Visionary in the 2022 Gartner® Magic Quadrant™ for Distributed File Systems and Objects Storage for the Second Year: Nutanix was named a Visionary in the Gartner October 2022 Magic Quadrant for Distributed File Systems and Objects Storage. This marks the second consecutive year that the Company has been recognized in this report.
- Nutanix Accelerates Kubernetes Adoption in the Enterprise: Nutanix announced broad support for leading Kubernetes container platforms, built-in infrastructure as code capabilities, and enhanced data services for modern applications. These new features allow DevOps teams to accelerate application delivery with the performance, governance, and flexibility of the Nutanix Cloud Platform while allowing customers to maintain control of their IT operating costs.
- Announced Corporate Governance Enhancements: In October 2022, the Board of Directors adopted majority voting in uncontested director elections and eliminated the supermajority vote requirement in the Company’s bylaws. The Company will seek stockholder approval to declassify the board and remove the supermajority voting requirements from its certificate of incorporation at its 2022 annual meeting of stockholders. These moves are expected to enhance the Company’s corporate governance profile and position the Company to continue to drive stockholder value.
Second Quarter Fiscal 2023 Outlook |
||
ACV Billings |
$245 - $250 million |
|
Revenue |
$460 - $470 million |
|
Non-GAAP Gross Margin |
82% to 83% |
|
Non-GAAP Operating Margin |
5% to 10% |
|
Weighted Average Shares Outstanding (Diluted) |
Approximately 279 million |
|
Fiscal 2023 Outlook |
||
ACV Billings |
$895 - $900 million |
|
Revenue |
$1.77 - $1.78 billion |
|
Non-GAAP Gross Margin |
82% to 83% |
|
Non-GAAP Operating Margin |
2% to 4% |
|
Supplementary materials to this press release, including our first quarter fiscal 2023 earnings presentation, can be found at https://ir.nutanix.com/company/financial.
Webcast and Conference Call Information
Nutanix executives will discuss the Company’s first quarter fiscal 2023 financial results on a conference call at 4:30 p.m. Eastern Time/1:30 p.m. Pacific Time. Interested parties may access the conference call by registering at this link to receive dial in details and a unique PIN number. The conference call will also be webcast live on the Nutanix Investor Relations website at ir.nutanix.com. An archived replay of the webcast will be available on the Nutanix Investor Relations website at ir.nutanix.com shortly after the call.
Definitions and Total Revenue Impact
1Annual Contract Value, or ACV, is defined as the total annualized value of a contract, excluding amounts related to professional services and hardware. The total annualized value for a contract is calculated by dividing the total value of the contract by the number of years in the term of such contract, using, where applicable, an assumed term of five years for contracts that do not have a specified term. ACV Billings, for any given period, is defined as the sum of the ACV for all contracts billed during the given period.
2Annual Recurring Revenue, or ARR, for any given period, is defined as the sum of ACV for all non life-of-device contracts in effect as of the end of a specific period. For the purposes of this calculation, we assume that the contract term begins on the date a contract is booked, unless the terms of such contract prevent us from fulfilling our obligations until a later period, and irrespective of the periods in which we would recognize revenue for such contract.
3Average Contract Term represents the dollar-weighted term, calculated on a billings basis, across all subscription and life-of-device contracts, using an assumed term of five years for life-of-device licenses, executed in the period.
4Revenue was negatively impacted by a year-over-year decline in the average contract term associated with Nutanix’s ongoing transition to a subscription-based business model.
Non-GAAP Financial Measures and Other Key Performance Measures
To supplement our consolidated financial statements, which are prepared and presented in accordance with GAAP, this press release includes the following non-GAAP financial and other key performance measures: non-GAAP gross margin, non-GAAP operating expenses, non-GAAP operating income (loss), non-GAAP operating margin, free cash flow, Annual Contract Value Billings (or ACV Billings), Annual Recurring Revenue (or ARR), and Average Contract Term. In computing these non-GAAP financial measures and key performance measures, we exclude certain items such as stock-based compensation and the related income tax impact, costs associated with our acquisitions (such as amortization of acquired intangible assets, income tax-related impact, and other acquisition-related costs), impairment and early exit of operating lease-related assets, restructuring charges, the change in fair value of the derivative liability, the amortization of the debt discount and issuance costs, interest expense related to convertible senior notes, loss on debt extinguishment, and other non-recurring transactions and the related tax impact. Non-GAAP gross margin, non-GAAP operating expenses, non-GAAP operating income (loss), and non-GAAP operating margin are financial measures which we believe provide useful information to investors because they provide meaningful supplemental information regarding our performance and liquidity by excluding certain expenses and expenditures such as stock-based compensation expense that may not be indicative of our ongoing core business operating results. Free cash flow is a performance measure that we believe provides useful information to our management and investors about the amount of cash generated by the business after necessary capital expenditures, and we define free cash flow as net cash provided by (used in) operating activities less purchases of property and equipment. ACV Billings is a performance measure that we believe provides useful information to our management and investors as it allows us to better track the topline growth of our business during our transition to a subscription-based business model because it takes into account variability in term lengths. ARR is a performance measure that we believe provides useful information to our management and investors as it allows us to better track the topline growth of our subscription business because it takes into account variability in term lengths. We use these non-GAAP financial and key performance measures for financial and operational decision-making and as a means to evaluate period-to-period comparisons. However, these non-GAAP financial and key performance measures have limitations as analytical tools and you should not consider them in isolation or as substitutes for analysis of our results as reported under GAAP. Non-GAAP gross margin, non-GAAP operating expenses, non-GAAP operating income (loss), non-GAAP operating margin, and free cash flow are not substitutes for gross margin, operating expenses, operating income (loss), operating margin, or net cash provided by (used in) operating activities, respectively. There is no GAAP measure that is comparable to ACV Billings, ARR, or Average Contract Term, so we have not reconciled the ACV Billings, ARR, or Average Contract Term data included in this press release to any GAAP measure. In addition, other companies, including companies in our industry, may calculate non-GAAP financial measures and key performance measures differently or may use other measures to evaluate their performance, all of which could reduce the usefulness of our non-GAAP financial measures and key performance measures as tools for comparison. We urge you to review the reconciliation of our non-GAAP financial measures and key performance measures to the most directly comparable GAAP financial measures included below in the tables captioned “Reconciliation of GAAP to Non-GAAP Profit Measures” and “Reconciliation of GAAP Net Cash Provided By Operating Activities to Non-GAAP Free Cash Flow,” and not to rely on any single financial measure to evaluate our business. This press release also includes the following forward-looking non-GAAP financial measures as part of our second quarter fiscal 2023 outlook and/or our fiscal 2023 outlook: non-GAAP gross margin and non-GAAP operating margin. We are unable to reconcile these forward-looking non-GAAP financial measures to their most directly comparable GAAP financial measures without unreasonable efforts, as we are currently unable to predict with a reasonable degree of certainty the type and extent of certain items that would be expected to impact the GAAP financial measures for these periods but would not impact the non-GAAP financial measures.
Forward-Looking Statements
This press release contains express and implied forward-looking statements, including, but not limited to, statements regarding: our business plans, strategies, initiatives, vision, objectives, and outlook (including our growth plan) as well as our ability to execute thereon successfully and in a timely manner and the benefits and impact thereof on our business, operations, and financial results (including our second quarter fiscal 2023 outlook, our fiscal 2023 outlook, our expectations regarding our focus on driving towards sustainable, profitable growth); our plans for, and the timing of, any current and future business model transitions, including our ongoing transition to a subscription-based business model, our ability to manage, complete or realize the benefits of such transitions successfully and in a timely manner, and the short-term and long-term impacts of such transitions on our business, operations and financial results; the competitive market, including our competitive position and ability to compete effectively, the competitive advantages of our products, our projections about our market share and opportunity, and the effects of increased competition in our market; our ability to attract new end customers and retain and grow sales from our existing end customers; our customer needs and our response to those needs; our ability to form new, and maintain and strengthen existing, strategic alliances and partnerships and address macroeconomic supply chain shortages, including our relationships with our channel partners and original equipment manufacturers, and the impact of any changes to such relationships on our business, operations and financial results; the benefits and capabilities of our platform, solutions, products, services and technology, including the interoperability and availability of our solutions with and on third-party platforms; our plans and expectations regarding new solutions, products, services, product features and technology, including those that are still under development or in process; our plans regarding, and the timing and success of, our customer, partner, industry, analyst, investor and employee events and the impact thereof on our business, operations, and financial results; the timing and potential impact of the COVID-19 pandemic on the global market environment and the IT industry, as well as on our business, operations and financial results, including the changes we have made or anticipate making in response to the COVID-19 pandemic, our ability to manage our business during the pandemic, and the position we anticipate being in following the pandemic; and our decision to use new or different metrics, or to make adjustments to the metrics we use, to supplement our financial reporting, and the impact thereof.
These forward-looking statements are not historical facts and instead are based on our current expectations, estimates, opinions, and beliefs. Consequently, you should not rely on these forward-looking statements. The accuracy of these forward-looking statements depends upon future events and involves risks, uncertainties, and other factors, including factors that may be beyond our control, that may cause these statements to be inaccurate and cause our actual results, performance or achievements to differ materially and adversely from those anticipated or implied by such statements, including, among others: failure to successfully implement or realize the full benefits of, or unexpected difficulties or delays in successfully implementing or realizing the full benefits of, our business plans, strategies, initiatives, vision, and objectives; our ability to achieve, sustain and/or manage future growth effectively; delays or unexpected accelerations in our current and future business model transitions; the rapid evolution of the markets in which we compete, including the introduction, or acceleration of adoption of, competing solutions, including public cloud infrastructure; failure to timely and successfully meet our customer needs; delays in or lack of customer or market acceptance of our new solutions, products, services, product features or technology; macroeconomic or geopolitical uncertainty, including supply chain issues; the timing, breadth, and impact of the COVID-19 pandemic on our business, operations, and financial results, as well as the impact on our customers, partners, and end markets; factors that could result in the significant fluctuation of our future quarterly operating results, including, among other things, anticipated changes to our revenue and product mix, including changes as a result of our transition to a subscription-based business model, the timing and magnitude of orders, shipments and acceptance of our solutions in any given quarter, our ability to attract new and retain existing end-customers, changes in the pricing and availability of certain components of our solutions, and fluctuations in demand and competitive pricing pressures for our solutions, attrition among sales representatives or other employees; and other risks detailed in our Annual Report on Form 10-K for the fiscal year ended July 31, 2022 filed with the U.S. Securities and Exchange Commission, or the SEC, on September 21, 2022. Additional information will also be set forth in our Quarterly Report on Form 10-Q for the fiscal quarter ended October 31, 2022, which should be read in conjunction with this press release and the financial results included herein. Our SEC filings are available on the Investor Relations section of our website at ir.nutanix.com and on the SEC's website at www.sec.gov. These forward-looking statements speak only as of the date of this press release and, except as required by law, we assume no obligation, and expressly disclaim any obligation, to update, alter or otherwise revise any of these forward-looking statements to reflect actual results or subsequent events or circumstances.
About Nutanix
Nutanix is a global leader in cloud software and a pioneer in hyperconverged infrastructure solutions, making clouds invisible, freeing customers to focus on their business outcomes. Organizations around the world use Nutanix software to leverage a single platform to manage any app at any location for their hybrid multicloud environments. Learn more at www.nutanix.com or follow us on social media @nutanix.
© 2022 Nutanix, Inc. All rights reserved. Nutanix, the Nutanix logo, and all Nutanix product and service names mentioned herein are registered trademarks or unregistered trademarks of Nutanix, Inc. in the United States and other countries. Other brand names and marks mentioned herein are for identification purposes only and may be the trademarks of their respective holder(s). This press release contains links to external websites that are not part of Nutanix.com. Nutanix does not control these sites and disclaims all responsibility for the content or accuracy of any external site. Our decision to link to an external site should not be considered an endorsement of any content on such a site.
NUTANIX, INC. |
||||||||
CONDENSED CONSOLIDATED BALANCE SHEETS |
||||||||
(Unaudited) |
||||||||
|
|
|
|
|||||
|
|
As of |
||||||
|
|
July 31,
|
|
October 31,
|
||||
|
|
(in thousands) |
||||||
Assets |
|
|
|
|
||||
Current assets: |
|
|
|
|
||||
Cash and cash equivalents |
$ |
402,850 |
|
$ |
480,617 |
|
||
Short-term investments |
|
921,429 |
|
|
907,441 |
|
||
Accounts receivable, net |
|
124,559 |
|
|
83,638 |
|
||
Deferred commissions—current |
|
115,356 |
|
|
109,871 |
|
||
Prepaid expenses and other current assets |
|
93,787 |
|
|
90,528 |
|
||
Total current assets |
|
1,657,981 |
|
|
1,672,095 |
|
||
Property and equipment, net |
|
113,440 |
|
|
111,361 |
|
||
Operating lease right-of-use assets |
|
118,740 |
|
|
111,522 |
|
||
Deferred commissions—non-current |
|
252,234 |
|
|
242,506 |
|
||
Intangible assets, net |
|
15,829 |
|
|
12,670 |
|
||
Goodwill |
|
185,260 |
|
|
185,260 |
|
||
Other assets—non-current |
|
22,265 |
|
|
22,008 |
|
||
Total assets |
$ |
2,365,749 |
|
$ |
2,357,422 |
|
||
Liabilities and Stockholders’ Deficit |
|
|
|
|
||||
Current liabilities: |
|
|
|
|
||||
Accounts payable |
$ |
44,931 |
|
$ |
30,838 |
|
||
Accrued compensation and benefits |
|
149,811 |
|
|
119,991 |
|
||
Accrued expenses and other current liabilities |
|
49,232 |
|
|
46,151 |
|
||
Deferred revenue—current |
|
720,993 |
|
|
768,918 |
|
||
Operating lease liabilities—current |
|
39,801 |
|
|
36,296 |
|
||
Convertible senior notes, net—current |
|
145,456 |
|
|
145,605 |
|
||
Total current liabilities |
|
1,150,224 |
|
|
1,147,799 |
|
||
Deferred revenue—non-current |
|
724,545 |
|
|
712,658 |
|
||
Operating lease liabilities—non-current |
|
89,782 |
|
|
81,820 |
|
||
Convertible senior notes, net |
|
1,156,205 |
|
|
1,176,259 |
|
||
Other liabilities—non-current |
|
35,161 |
|
|
29,935 |
|
||
Total liabilities |
|
3,155,917 |
|
|
3,148,471 |
|
||
Stockholders’ deficit: |
|
|
|
|
||||
Common stock |
|
6 |
|
|
6 |
|
||
Additional paid-in capital |
|
3,583,928 |
|
|
3,685,805 |
|
||
Accumulated other comprehensive income |
|
(6,076 |
) |
|
(9,718 |
) |
||
Accumulated deficit |
|
(4,368,026 |
) |
|
(4,467,142 |
) |
||
Total stockholders’ deficit |
|
(790,168 |
) |
|
(791,049 |
) |
||
Total liabilities and stockholders’ deficit |
$ |
2,365,749 |
|
$ |
2,357,422 |
|
||
| NUTANIX, INC. | ||||||||
CONDENSED CONSOLIDATED STATEMENTS OF OPERATIONS |
||||||||
(Unaudited) |
||||||||
|
|
|
|
|||||
|
|
Three Months Ended
|
||||||
|
|
2021 |
|
2022 |
||||
|
|
(in thousands, except per share data) |
||||||
Revenue: |
|
|
|
|
||||
Product |
$ |
180,105 |
|
$ |
208,574 |
|
||
Support, entitlements and other services |
|
198,412 |
|
|
225,035 |
|
||
Total revenue |
|
378,517 |
|
|
433,609 |
|
||
Cost of revenue: |
|
|
|
|
||||
Product (1)(2) |
|
14,221 |
|
|
12,516 |
|
||
Support, entitlements and other services (1) |
|
67,225 |
|
|
69,979 |
|
||
Total cost of revenue |
|
81,446 |
|
|
82,495 |
|
||
Gross profit |
|
297,071 |
|
|
351,114 |
|
||
Operating expenses: |
|
|
|
|
||||
Sales and marketing (1)(2) |
|
250,033 |
|
|
236,072 |
|
||
Research and development (1) |
|
144,266 |
|
|
149,195 |
|
||
General and administrative (1) |
|
40,028 |
|
|
46,104 |
|
||
Total operating expenses |
|
434,327 |
|
|
431,371 |
|
||
Loss from operations |
|
(137,256 |
) |
|
(80,257 |
) |
||
Other expense, net |
|
(278,549 |
) |
|
(13,416 |
) |
||
Loss before provision for income taxes |
|
(415,805 |
) |
|
(93,673 |
) |
||
Provision for income taxes |
|
4,047 |
|
|
5,443 |
|
||
Net loss |
$ |
(419,852 |
) |
$ |
(99,116 |
) |
||
Net loss per share attributable to Class A and Class B common stockholders—basic and diluted (3) |
$ |
(1.95 |
) |
$ |
(0.43 |
) |
||
Weighted average shares used in computing net loss per share attributable to Class A and Class B common stockholders—basic and diluted (3) |
|
215,499 |
|
|
228,544 |
|
||
| ____________________ | ||||||||
(1) Includes the following stock-based compensation expense: |
||||||||
|
Three Months Ended
|
|||||||
|
2021 |
|
2022 |
|||||
|
(in thousands) |
|||||||
Product cost of revenue |
$ |
1,751 |
|
$ |
2,159 |
|
||
Support, entitlements and other services cost of revenue |
|
8,451 |
|
|
5,346 |
|
||
Sales and marketing |
|
29,132 |
|
|
20,472 |
|
||
Research and development |
|
38,479 |
|
|
38,622 |
|
||
General and administrative |
|
12,734 |
|
|
14,356 |
|
||
Total stock-based compensation expense |
$ |
90,547 |
|
$ |
80,955 |
|
||
(2) Includes the following amortization of intangible assets: |
||||||||
|
Three Months Ended
|
|||||||
|
2021 |
|
2022 |
|||||
|
(in thousands) |
|||||||
Product cost of revenue |
$ |
3,476 |
|
$ |
2,810 |
|
||
Sales and marketing |
|
651 |
|
|
349 |
|
||
Total amortization of intangible assets |
$ |
4,127 |
|
$ |
3,159 |
|
||
(3) |
Effective January 3, 2022, all of the then outstanding shares of Nutanix, Inc. Class B common stock were automatically converted into the same number of shares of Nutanix, Inc. Class A common stock. |
| NUTANIX, INC. | ||||||||
CONDENSED CONSOLIDATED STATEMENTS OF CASH FLOWS |
||||||||
(Unaudited) |
||||||||
|
|
|
||||||
|
|
Three Months Ended
|
||||||
|
|
2021 |
|
2022 |
||||
|
|
(in thousands) |
||||||
Cash flows from operating activities: |
|
|
|
|
||||
Net loss |
$ |
(419,852 |
) |
$ |
(99,116 |
) |
||
Adjustments to reconcile net loss to net cash provided by operating activities: |
|
|
|
|
||||
Depreciation and amortization |
|
23,291 |
|
|
19,839 |
|
||
Stock-based compensation |
|
90,547 |
|
|
80,955 |
|
||
Change in fair value of derivative liability |
|
198,038 |
|
|
— |
|
||
Loss on debt extinguishment |
|
64,910 |
|
|
— |
|
||
Amortization of debt discount and issuance costs |
|
9,831 |
|
|
10,477 |
|
||
Operating lease cost, net of accretion |
|
9,189 |
|
|
8,722 |
|
||
Early exit of lease-related assets |
|
— |
|
|
(304 |
) |
||
Non-cash interest expense |
|
4,773 |
|
|
4,894 |
|
||
Other |
|
3,072 |
|
|
(776 |
) |
||
Changes in operating assets and liabilities: |
|
|
|
|
||||
Accounts receivable, net |
|
64,740 |
|
|
40,838 |
|
||
Deferred commissions |
|
(6,225 |
) |
|
15,213 |
|
||
Prepaid expenses and other assets |
|
6,751 |
|
|
958 |
|
||
Accounts payable |
|
(3,139 |
) |
|
(7,104 |
) |
||
Accrued compensation and benefits |
|
(39,965 |
) |
|
(29,820 |
) |
||
Accrued expenses and other liabilities |
|
(6,207 |
) |
|
(3,474 |
) |
||
Operating leases, net |
|
(12,323 |
) |
|
(11,910 |
) |
||
Deferred revenue |
|
19,508 |
|
|
36,121 |
|
||
Net cash provided by operating activities |
|
6,939 |
|
|
65,513 |
|
||
Cash flows from investing activities: |
|
|
|
|
||||
Maturities of investments |
|
272,024 |
|
|
267,667 |
|
||
Purchases of investments |
|
(290,050 |
) |
|
(256,202 |
) |
||
Sales of investments |
|
17,999 |
|
|
— |
|
||
Purchases of property and equipment |
|
(8,844 |
) |
|
(19,702 |
) |
||
Net cash used in investing activities |
|
(8,871 |
) |
|
(8,237 |
) |
||
Cash flows from financing activities: |
|
|
|
|
||||
Proceeds from sales of shares through employee equity incentive plans |
|
30,139 |
|
|
22,186 |
|
||
Payments of debt extinguishment costs |
|
(14,709 |
) |
|
— |
|
||
Proceeds from unwinding of convertible note hedges |
|
39,880 |
|
|
— |
|
||
Payments for unwinding of warrants |
|
(18,390 |
) |
|
— |
|
||
Proceeds from the issuance of convertible notes, net of issuance costs |
|
89,128 |
|
|
— |
|
||
Repurchases of common stock |
|
(58,570 |
) |
|
— |
|
||
Payment of finance lease obligations |
|
(219 |
) |
|
(1,856 |
) |
||
Net cash provided by financing activities |
|
67,259 |
|
|
20,330 |
|
||
Net increase in cash, cash equivalents and restricted cash |
$ |
65,327 |
|
$ |
77,606 |
|
||
Cash, cash equivalents and restricted cash—beginning of period |
|
288,873 |
|
|
405,862 |
|
||
Cash, cash equivalents and restricted cash—end of period |
$ |
354,200 |
|
$ |
483,468 |
|
||
Restricted cash (1) |
|
3,215 |
|
|
2,851 |
|
||
Cash and cash equivalents—end of period |
$ |
350,985 |
|
$ |
480,617 |
|
||
Supplemental disclosures of cash flow information: |
|
|
|
|
||||
Cash paid for income taxes |
$ |
6,181 |
|
$ |
7,635 |
|
||
Supplemental disclosures of non-cash investing and financing information: |
|
|
|
|
||||
Purchases of property and equipment included in accounts payable and accrued and other liabilities |
$ |
12,099 |
|
$ |
10,748 |
|
||
Finance lease liabilities arising from obtaining right-of-use assets |
$ |
7,857 |
|
$ |
9,822 |
|
||
Convertible senior notes offering costs included in accrued liabilities |
$ |
700 |
|
$ |
— |
|
||
| ____________________ | |
(1) |
Included within other assets—non-current in the condensed consolidated balance sheets. |
| Reconciliation of Revenue to Billings | ||||||||
(Unaudited) |
||||||||
|
|
|
|
|||||
|
|
Three Months Ended
|
||||||
|
|
2021 |
|
2022 |
||||
|
|
(in thousands) |
||||||
Total revenue |
|
$ |
378,517 |
|
|
$ |
433,609 |
|
Change in deferred revenue |
|
|
19,508 |
|
|
|
36,121 |
|
Total billings |
|
$ |
398,025 |
|
|
$ |
469,730 |
|
Disaggregation of Revenue and Billings |
||||||||
(Unaudited) |
||||||||
|
|
|
|
|||||
|
|
Three Months Ended
|
||||||
|
|
2021 |
|
2022 |
||||
|
|
(in thousands) |
||||||
Disaggregation of revenue: |
|
|
|
|
|
|
||
Subscription revenue |
|
$ |
337,901 |
|
|
$ |
402,924 |
|
Non-portable software revenue |
|
|
14,337 |
|
|
|
7,783 |
|
Hardware revenue |
|
|
2,163 |
|
|
|
624 |
|
Professional services revenue |
|
|
24,116 |
|
|
|
22,278 |
|
Total revenue |
|
$ |
378,517 |
|
|
$ |
433,609 |
|
Disaggregation of billings: |
|
|
|
|
|
|
||
Subscription billings |
|
$ |
359,323 |
|
|
$ |
441,430 |
|
Non-portable software billings |
|
|
14,337 |
|
|
|
7,783 |
|
Hardware billings |
|
|
2,163 |
|
|
|
624 |
|
Professional services billings |
|
|
22,202 |
|
|
|
19,893 |
|
Total billings |
|
$ |
398,025 |
|
|
$ |
469,730 |
|
Subscription — Subscription revenue includes any performance obligation which has a defined term, and is generated from the sales of software entitlement and support subscriptions, subscription software licenses and cloud-based Software as a Service, or SaaS offerings.
- Ratable — We recognize revenue from software entitlement and support subscriptions and SaaS offerings ratably over the contractual service period, the substantial majority of which relate to software entitlement and support subscriptions.
- Upfront — Revenue from our subscription software licenses is generally recognized upfront upon transfer of control to the customer, which happens when we make the software available to the customer.
Non-portable software — Non-portable software revenue includes sales of our enterprise cloud platform when delivered on a configured-to-order appliance by us or one of our OEM partners. The software licenses associated with these sales are typically non-portable and have a term equal to the life of the appliance on which the software is delivered. Revenue from our non-portable software products is generally recognized upon transfer of control to the customer.
Hardware — In transactions where we deliver the hardware appliance, we consider ourselves to be the principal in the transaction and we record revenue and costs of goods sold on a gross basis. We consider the amount allocated to hardware revenue to be equivalent to the cost of the hardware procured. Hardware revenue is generally recognized upon transfer of control to the customer.
Professional services — We also sell professional services with our products. We recognize revenue related to professional services as they are performed.
Annual Contract Value Billings and Annual Recurring Revenue |
||||||||
(Unaudited) |
||||||||
|
|
|
||||||
|
|
Three Months Ended
|
||||||
|
|
2021 |
|
2022 |
||||
|
|
(in thousands) |
||||||
Annual Contract Value Billings (ACV Billings) |
|
$ |
183,334 |
|
|
$ |
231,928 |
|
Annual Recurring Revenue (ARR) |
|
$ |
952,638 |
|
|
$ |
1,280,574 |
|
Reconciliation of Subscription and Professional Services Revenue to Subscription and Professional Services Billings |
||||||||
(Unaudited) |
||||||||
|
|
|
||||||
|
|
Three Months Ended
|
||||||
|
|
2021 |
|
2022 |
||||
|
|
(in thousands) |
||||||
Subscription revenue |
|
$ |
337,901 |
|
|
$ |
402,924 |
|
Change in subscription deferred revenue |
|
|
21,422 |
|
|
|
38,506 |
|
Subscription billings |
|
$ |
359,323 |
|
|
$ |
441,430 |
|
|
|
|
|
|
|
|
||
Professional services revenue |
|
$ |
24,116 |
|
|
$ |
22,278 |
|
Change in professional services deferred revenue |
|
|
(1,914 |
) |
|
|
(2,385 |
) |
Professional services billings |
|
$ |
22,202 |
|
|
$ |
19,893 |
|
| Reconciliation of GAAP to Non-GAAP Profit Measures | ||||||||||||||||||||||||||||||||||||
(Unaudited) |
||||||||||||||||||||||||||||||||||||
|
|
|
|
|
|
|
|
|
||||||||||||||||||||||||||||
|
|
GAAP |
|
Non-GAAP Adjustments |
|
Non-GAAP |
||||||||||||||||||||||||||||||
|
|
Three Months Ended October 31, 2022 |
|
(1) |
|
(2) |
|
(3) |
|
(4) |
|
(5) |
|
(6) |
|
Three Months Ended October 31, 2022 |
||||||||||||||||||||
|
|
(in thousands, except percentages and per share data) |
||||||||||||||||||||||||||||||||||
Gross profit |
$ |
351,114 |
|
$ |
7,505 |
|
$ |
2,810 |
|
$ |
— |
|
$ |
265 |
|
$ |
— |
|
$ |
— |
|
$ |
361,694 |
|
||||||||||||
Gross margin |
|
81.0 |
% |
|
1.7 |
% |
|
0.6 |
% |
|
— |
|
|
0.1 |
% |
|
— |
|
|
— |
|
|
83.4 |
% |
||||||||||||
Operating expenses: |
|
|
|
|
|
|
|
|
|
|
|
|
|
|
||||||||||||||||||||||
Sales and marketing |
|
236,072 |
|
|
(20,472 |
) |
|
(349 |
) |
|
— |
|
|
(3,816 |
) |
|
— |
|
|
— |
|
|
211,435 |
|
||||||||||||
Research and development |
|
149,195 |
|
|
(38,622 |
) |
|
— |
|
|
— |
|
|
(1,616 |
) |
|
— |
|
|
— |
|
|
108,957 |
|
||||||||||||
General and administrative |
|
46,104 |
|
|
(14,356 |
) |
|
— |
|
|
(920 |
) |
|
(120 |
) |
|
— |
|
|
— |
|
|
30,708 |
|
||||||||||||
Total operating expenses |
|
431,371 |
|
|
(73,450 |
) |
|
(349 |
) |
|
(920 |
) |
|
(5,552 |
) |
|
— |
|
|
— |
|
|
351,100 |
|
||||||||||||
(Loss) income from operations |
|
(80,257 |
) |
|
80,955 |
|
|
3,159 |
|
|
920 |
|
|
5,817 |
|
|
— |
|
|
— |
|
|
10,594 |
|
||||||||||||
Operating margin |
|
(18.5 |
)% |
|
18.7 |
% |
|
0.7 |
% |
|
0.2 |
% |
|
1.3 |
% |
|
— |
|
|
— |
|
|
2.4 |
% |
||||||||||||
Net (loss) income |
$ |
(99,116 |
) |
$ |
80,955 |
|
$ |
3,159 |
|
$ |
920 |
|
$ |
5,817 |
|
$ |
15,731 |
|
$ |
504 |
|
$ |
7,970 |
|
||||||||||||
Weighted shares outstanding, basic |
|
228,544 |
|
|
|
|
|
|
|
|
|
|
|
|
228,544 |
|
||||||||||||||||||||
Weighted shares outstanding, diluted (7) |
|
228,544 |
|
|
|
|
|
|
|
|
|
|
|
|
275,200 |
|
||||||||||||||||||||
Net (loss) income per share, basic |
$ |
(0.43 |
) |
$ |
0.35 |
|
$ |
0.01 |
|
$ |
- |
|
$ |
0.03 |
|
$ |
0.07 |
|
$ |
- |
|
$ |
0.03 |
|
||||||||||||
Net (loss) income per share, diluted |
$ |
(0.43 |
) |
|
|
|
|
|
|
|
|
|
|
$ |
0.03 |
|
||||||||||||||||||||
| ____________________ | ||
(1) |
Stock-based compensation expense |
|
(2) |
Amortization of intangible assets |
|
(3) |
Costs related to early exit of existing leases |
|
(4) |
Restructuring charges |
|
(5) |
Amortization of debt discount and issuance costs and interest expense related to convertible senior notes |
|
(6) |
Income tax effect primarily related to stock-based compensation expense |
|
(7) |
Includes 46,656 potentially dilutive shares related to convertible senior notes and the issuance of shares under employee equity incentive plans |
|
GAAP |
|
Non-GAAP Adjustments |
|
Non-GAAP |
|||||||||||||||||||||||||||||||||||
|
Three Months Ended October 31, 2021 |
|
(1) |
|
(2) |
|
(3) |
|
(4) |
|
(5) |
|
(6) |
|
(7) |
|
Three Months Ended October 31, 2021 |
||||||||||||||||||||||
|
(in thousands, except percentages and per share data) |
||||||||||||||||||||||||||||||||||||||
Gross profit |
$ |
297,071 |
|
$ |
10,202 |
|
$ |
3,476 |
|
$ |
— |
|
$ |
— |
|
$ |
— |
|
$ |
— |
|
$ |
— |
|
$ |
310,749 |
|
||||||||||||
Gross margin |
|
78.5 |
% |
|
2.7 |
% |
|
0.9 |
% |
|
— |
|
|
— |
|
|
— |
|
|
— |
|
|
— |
|
|
82.1 |
% |
||||||||||||
Operating expenses: |
|
|
|
|
|
|
|
|
|
|
|
|
|
|
|||||||||||||||||||||||||
Sales and marketing |
|
250,033 |
|
|
(29,132 |
) |
|
(651 |
) |
|
— |
|
|
— |
|
|
— |
|
|
— |
|
|
— |
|
|
220,250 |
|
||||||||||||
Research and development |
|
144,266 |
|
|
(38,479 |
) |
|
— |
|
|
— |
|
|
— |
|
|
— |
|
|
— |
|
|
— |
|
|
105,787 |
|
||||||||||||
General and administrative |
|
40,028 |
|
|
(12,734 |
) |
|
— |
|
|
(705 |
) |
|
— |
|
|
— |
|
|
— |
|
|
— |
|
|
26,589 |
|
||||||||||||
Total operating expenses |
|
434,327 |
|
|
(80,345 |
) |
|
(651 |
) |
|
(705 |
) |
|
— |
|
|
— |
|
|
— |
|
|
— |
|
|
352,626 |
|
||||||||||||
Loss from operations |
|
(137,256 |
) |
|
90,547 |
|
|
4,127 |
|
|
705 |
|
|
— |
|
|
— |
|
|
— |
|
|
— |
|
|
(41,877 |
) |
||||||||||||
Operating margin |
|
(36.3 |
)% |
|
23.9 |
% |
|
1.1 |
% |
|
0.2 |
% |
|
— |
|
|
— |
|
|
— |
|
|
— |
|
|
(11.1 |
)% |
||||||||||||
Net loss |
$ |
(419,852 |
) |
$ |
90,547 |
|
$ |
4,127 |
|
$ |
705 |
|
$ |
198,038 |
|
$ |
14,756 |
|
$ |
64,911 |
|
$ |
261 |
|
$ |
(46,507 |
) |
||||||||||||
Weighted shares outstanding, basic and diluted |
|
215,499 |
|
|
|
|
|
|
|
|
|
|
|
|
215,499 |
|
|||||||||||||||||||||||
Net loss per share, basic and diluted |
$ |
(1.95 |
) |
$ |
0.42 |
|
$ |
0.02 |
|
$ |
- |
|
$ |
0.92 |
|
$ |
0.07 |
|
$ |
0.30 |
|
$ |
- |
|
$ |
(0.22 |
) |
||||||||||||
| ____________________ | ||
(1) |
|
Stock-based compensation expense |
(2) |
|
Amortization of intangible assets |
(3) |
|
Other |
(4) |
|
Change in fair value of derivative liability |
(5) |
|
Amortization of debt discount and issuance costs and interest expense related to convertible senior notes |
(6) |
|
Loss on debt extinguishment |
(7) |
|
Income tax effect primarily related to stock-based compensation expense |
| Reconciliation of GAAP Net Cash Provided by Operating Activities to Non-GAAP Free Cash Flow | ||||||||
(Unaudited) |
||||||||
|
|
|
||||||
|
|
Three Months Ended
|
||||||
|
|
2021 |
|
2022 |
||||
|
|
(in thousands) |
||||||
Net cash provided by operating activities |
|
$ |
6,939 |
|
|
$ |
65,513 |
|
Purchases of property and equipment |
|
|
(8,844 |
) |
|
|
(19,702 |
) |
Free cash flow |
|
$ |
(1,905 |
) |
|
$ |
45,811 |
|
View source version on businesswire.com: https://www.businesswire.com/news/home/20221130005395/en/
Contacts
Investor Contact:
Richard Valera
ir@nutanix.com
Media Contact:
Jennifer Massaro
pr@nutanix.com