
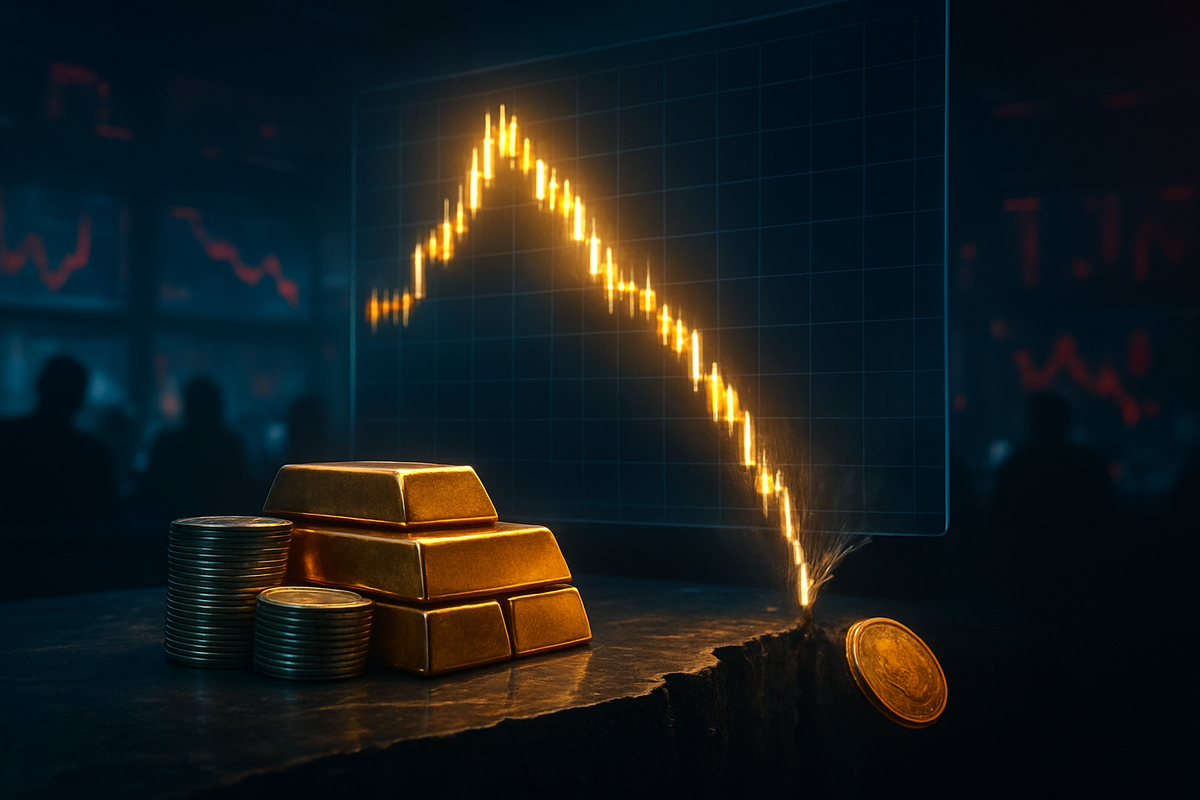
The global financial markets witnessed a historic "blow-off top" on January 30, 2026, as the multi-month parabolic surge in precious metals came to a screeching halt. In a single trading session, gold plummeted 6% while silver suffered a staggering 15% collapse, sent reeling just hours after hitting lifetime highs of $5,500 and $120 per ounce, respectively. This violent reversal has sent shockwaves through the commodities sector, erasing billions in paper wealth and leaving a trail of margin calls for the late-arriving retail crowd that had flooded into the market during the first three weeks of the year.
The immediate implications are profound: the technical "exhaustion" pattern seen today suggests that the primary drivers of the 2025-2026 bull run—geopolitical instability and systemic debt fears—may have been fully priced in, if not over-extended. As liquidity vanished during the Friday morning sell-off, the SPDR Gold Trust (NYSEArca: GLD) and the iShares Silver Trust (NYSEArca: SLV) saw record-breaking turnover, signaling a massive transfer of risk from institutional "smart money" to a retail base that appears to have entered at the absolute peak of the mania.
The Anatomy of a Collapse: From Mania to Meltdown
The seeds of the January 30 crash were sown throughout a frantic month that saw the SPDR Gold Trust (NYSEArca: GLD) absorb a staggering $95 million in retail inflows. Driven by a "perfect storm" of geopolitical friction—including escalating trade disputes over Greenland and renewed tensions in the Middle East—investors viewed precious metals as the only remaining sanctuary. By January 28, the market had entered a vertical "mania phase," with silver prices jumping $20 in just 48 hours to touch the $120 mark. This move was fueled largely by a massive "gamma squeeze" in the options market, where the call-to-put ratio on the iShares Silver Trust (NYSEArca: SLV) reached an unsustainable 4.2-to-1.
The reversal began in the early hours of January 30, triggered by a confluence of macroeconomic shifts. First, rumors intensified that hard-money advocate Kevin Warsh was the frontrunner for the next Federal Reserve chairmanship, a move markets interpreted as the end of the "easy money" era. Simultaneously, a surprise breakthrough in U.S. budget negotiations removed the immediate threat of a government shutdown, stripping away a primary "risk-off" pillar that had supported the gold rally. When the December Producer Price Index (PPI) data arrived slightly cooler than the most catastrophic forecasts, the "sell the news" frenzy began in earnest.
By the time the New York floor opened, the selling had turned into a "downside flush." Within a 60-minute window, silver prices dropped 12% as automated stop-loss orders were triggered across the board. Technical analysts noted that the monthly Relative Strength Index (RSI) for silver had eclipsed 95—a level historically associated with terminal exhaustion. The daily charts for both gold and silver formed a "dark cloud cover" candlestick pattern, a classic technical signal that a long-term top is likely in place.
Winners and Losers in the Aftermath
The carnage was not distributed equally across the sector. Major mining conglomerates, which had seen their valuations skyrocket in early January, bore the brunt of the equity sell-off. Newmont Corporation (NYSE: NEM) and Barrick Gold Corporation (NYSE: GOLD) saw their shares slide 8% and 9% respectively, as investors reconsidered the sustainability of $5,500 gold for long-term production modeling. Silver-leveraged plays were hit even harder; Pan American Silver Corp. (NASDAQ: PAAS) and First Majestic Silver Corp. (NYSE: AG) experienced double-digit percentage drops as the "speculative premium" evaporated from their share prices.
Conversely, the day’s winners were found among the contrarians and the nimble. Short sellers and put-option holders on the SLV ETF realized gains of 100% or more in a matter of hours. Furthermore, the U.S. Dollar Index (DXY), which had been languishing at four-year lows, staged a violent 0.5% recovery, providing a windfall for currency traders who had bet on a "mean reversion" trade. Institutional bullion banks, which had reportedly been building significant short positions against the retail-led rally, are expected to report massive quarterly profits from the rapid decline in spot prices.
A Wider Significance: The End of the Parabolic Era?
This event marks a critical turning point in the post-2024 economic cycle. The 2026 precious metals crash bears a striking resemblance to the silver collapse of 1980 and the 2011 "double top" in gold. In both historical instances, a parabolic move driven by retail speculation and inflationary fears eventually collapsed under the weight of its own momentum and a tightening of monetary expectations. The current $111 trillion global debt load remains a long-term tailwind for gold, but the January 30 reversal suggests that the market’s "fear gauge" may have reached a temporary limit.
Furthermore, the volatility highlights a growing divide between physical and paper markets. While ETF prices plummeted, physical bullion premiums at major dealers like APMEX remained stubbornly high, as many long-term holders refused to liquidate their physical bars. This decoupling suggests that while the "paper" price reflected in GLD and SLV is under pressure from liquidations and margin calls, the fundamental distrust in fiat currency that drove prices to $5,500 has not been entirely resolved. Regulatory bodies are now expected to scrutinize the extreme leverage used in silver options during the January run-up, potentially leading to higher margin requirements for commodity ETFs.
The Road Ahead: Stabilization or Deeper Correction?
In the short term, the technical damage to the charts is severe. Market veterans expect a period of "re-calibration" where gold and silver trade within a wide, volatile range as the "weak hands" are shaken out. Support for gold is now pegged at the $4,800 level, while silver may seek a bottom near its previous breakout zone of $85 to $90. Strategic pivots are already underway; institutional investors are likely to move away from "momentum-chasing" and toward "value-entry" once the dust settles and the Federal Reserve's new leadership path is confirmed.
The coming months will test the resilience of the silver-industrial complex. With the "structural deficit" in silver still intact due to demand from AI data centers and the EV sector, a lower price point may actually spark a new wave of industrial buying. However, for the retail investors who entered GLD at the $5,500 peak, the path to recovery may be long. The market is now looking for a period of consolidation—a "sideways grind"—to work off the extreme overbought conditions before any attempt at a new all-time high can be made.
Closing Thoughts: A Lesson in Market Gravity
The events of January 30, 2026, serve as a stark reminder that no asset class, no matter how "safe," is immune to the laws of market gravity. The transition from record highs to a 15% silver plunge in a single day underscores the danger of parabolic runs fueled by retail FOMO and extreme options leverage. While the long-term structural case for precious metals as a hedge against a $111 trillion debt world remains intact, the "mania phase" has clearly ended.
Investors should watch the $5,000 gold level closely in the coming weeks; a failure to hold this psychological support could signal a deeper retracement into the $4,500 range. For the silver market, the focus will remain on the DXY and the potential for a "Warsh Fed" to stabilize the dollar. As the dust settles on this historic reversal, the key takeaway is clear: in the world of commodities, the faster the ascent, the more painful the descent.
This content is intended for informational purposes only and is not financial advice


