

American motorcycle manufacturing company Harley-Davidson (NYSE: HOG) fell short of the markets revenue expectations in Q3 CY2025, with sales falling 6.7% year on year to $1.07 billion. Its GAAP profit of $3.10 per share was 89.3% above analysts’ consensus estimates.
Is now the time to buy Harley-Davidson? Find out by accessing our full research report, it’s free for active Edge members.
Harley-Davidson (HOG) Q3 CY2025 Highlights:
- Revenue: $1.07 billion vs analyst estimates of $1.32 billion (6.7% year-on-year decline, 18.8% miss)
- EPS (GAAP): $3.10 vs analyst estimates of $1.64 (89.3% beat)
- Operating Margin: 44.2%, up from 9.2% in the same quarter last year
- Free Cash Flow was -$129.1 million, down from $300.4 million in the same quarter last year
- Motorcycles Sold: 36,500, up 8,980 year on year
- Market Capitalization: $3.30 billion
Company Overview
Founded in 1903, Harley-Davidson (NYSE: HOG) is an American motorcycle manufacturer known for its heavyweight motorcycles designed for cruising on highways.
Revenue Growth
Examining a company’s long-term performance can provide clues about its quality. Any business can put up a good quarter or two, but many enduring ones grow for years. Unfortunately, Harley-Davidson struggled to consistently increase demand as its $4.40 billion of sales for the trailing 12 months was close to its revenue five years ago. This was below our standards and is a sign of poor business quality.
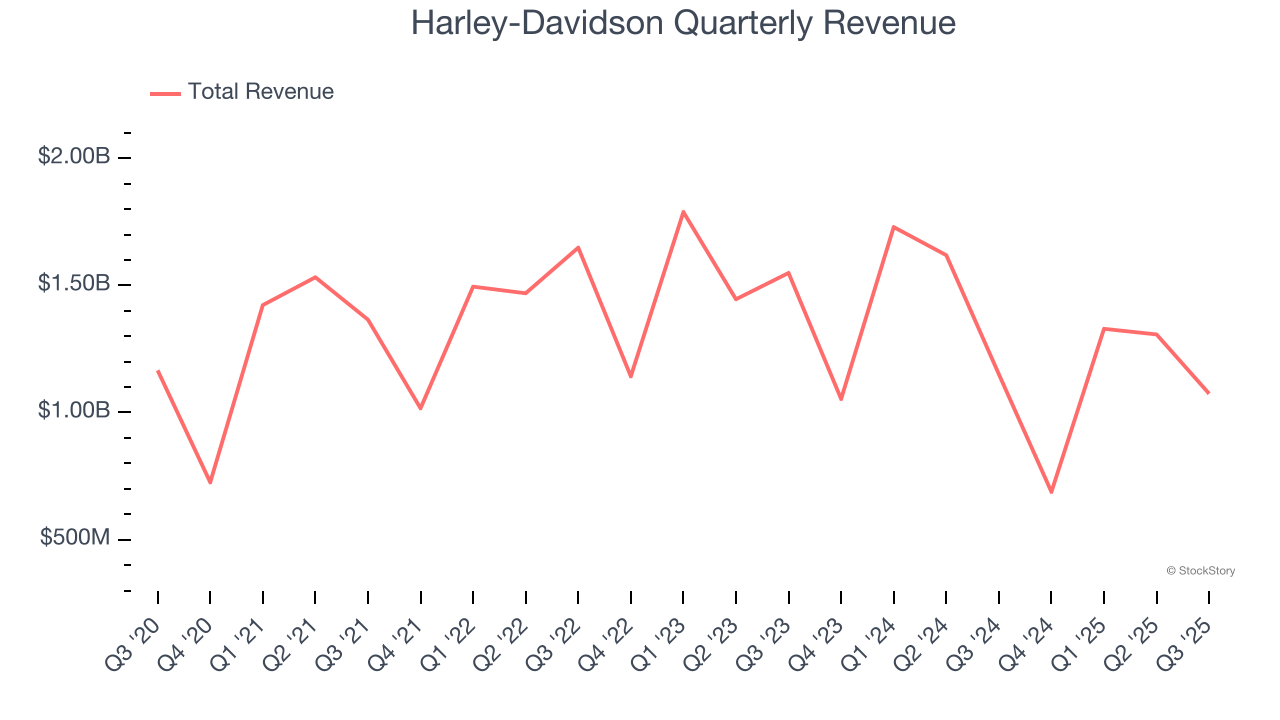
Long-term growth is the most important, but within consumer discretionary, product cycles are short and revenue can be hit-driven due to rapidly changing trends and consumer preferences. Harley-Davidson’s recent performance shows its demand remained suppressed as its revenue has declined by 13.8% annually over the last two years. 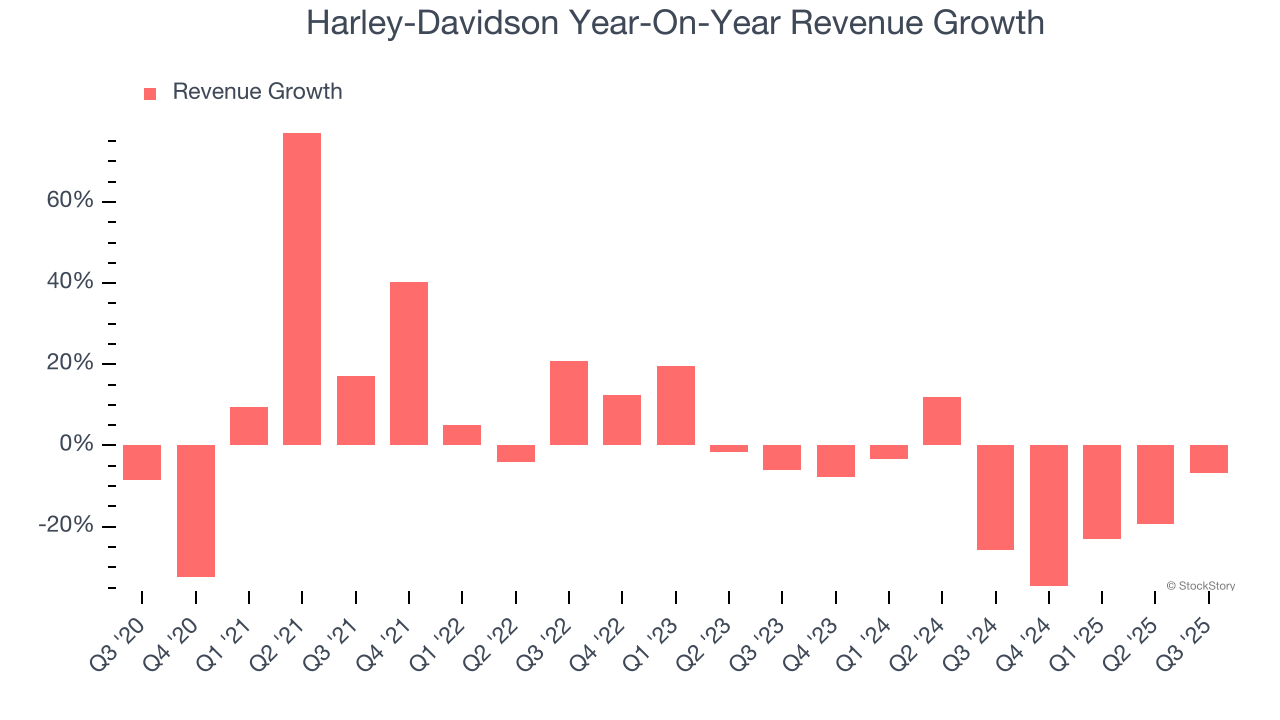
We can dig further into the company’s revenue dynamics by analyzing its number of motorcycles sold, which reached 36,500 in the latest quarter. Over the last two years, Harley-Davidson’s motorcycles sold averaged 15.6% year-on-year declines. Because this number is lower than its revenue growth during the same period, we can see the company’s monetization has risen. 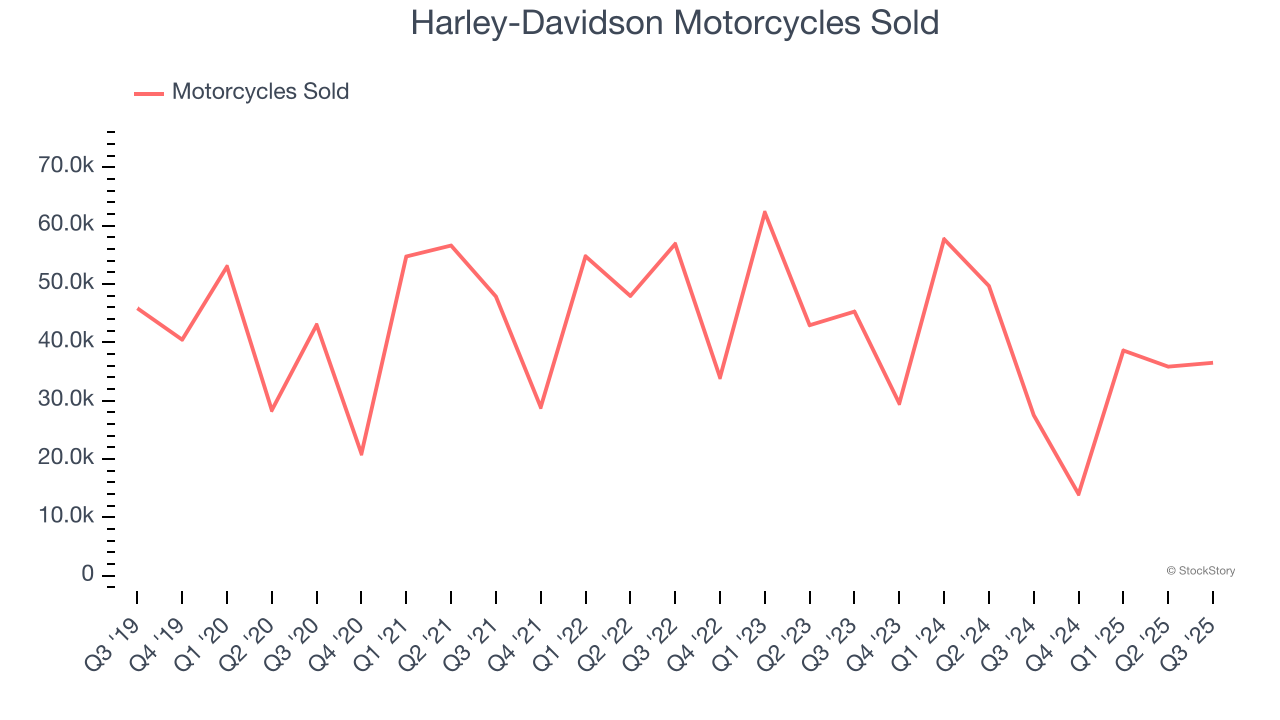
This quarter, Harley-Davidson missed Wall Street’s estimates and reported a rather uninspiring 6.7% year-on-year revenue decline, generating $1.07 billion of revenue.
Looking ahead, sell-side analysts expect revenue to grow 1.8% over the next 12 months. Although this projection implies its newer products and services will catalyze better top-line performance, it is still below average for the sector.
Software is eating the world and there is virtually no industry left that has been untouched by it. That drives increasing demand for tools helping software developers do their jobs, whether it be monitoring critical cloud infrastructure, integrating audio and video functionality, or ensuring smooth content streaming. Click here to access a free report on our 3 favorite stocks to play this generational megatrend.
Operating Margin
Operating margin is a key measure of profitability. Think of it as net income - the bottom line - excluding the impact of taxes and interest on debt, which are less connected to business fundamentals.
Harley-Davidson’s operating margin has been trending up over the last 12 months and averaged 11.5% over the last two years. Its profitability was higher than the broader consumer discretionary sector, showing it did a decent job managing its expenses.
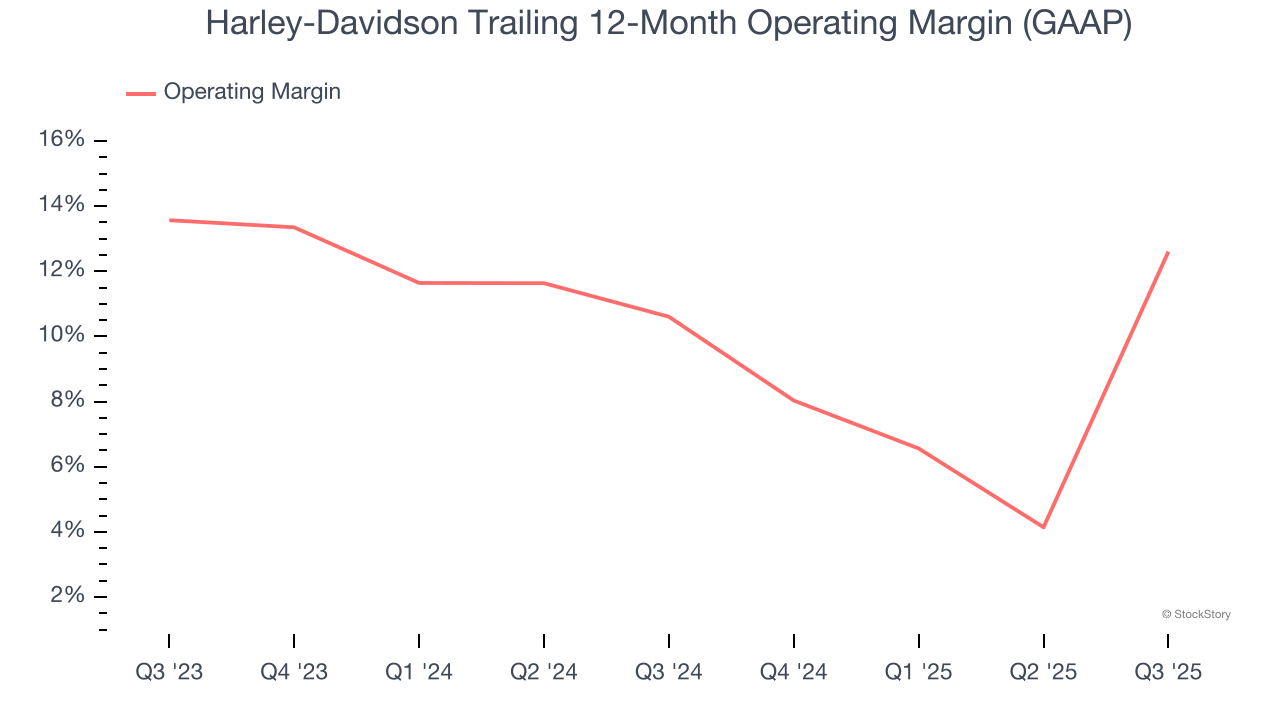
This quarter, Harley-Davidson generated an operating margin profit margin of 44.2%, up 35 percentage points year on year. This increase was a welcome development, especially since its revenue fell, showing it was more efficient because it scaled down its expenses.
Earnings Per Share
Revenue trends explain a company’s historical growth, but the long-term change in earnings per share (EPS) points to the profitability of that growth – for example, a company could inflate its sales through excessive spending on advertising and promotions.
Harley-Davidson’s EPS grew at an astounding 41.7% compounded annual growth rate over the last five years, higher than its flat revenue. This tells us management responded to softer demand by adapting its cost structure.
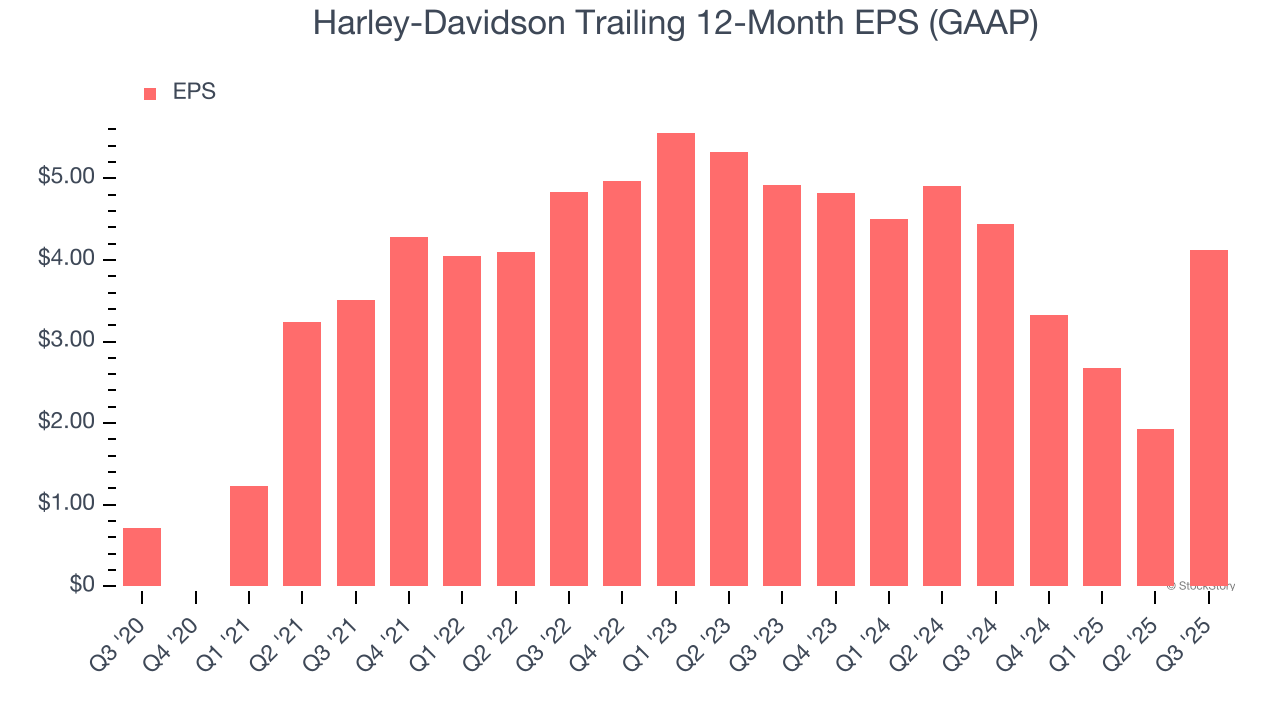
In Q3, Harley-Davidson reported EPS of $3.10, up from $0.91 in the same quarter last year. This print easily cleared analysts’ estimates, and shareholders should be content with the results. Over the next 12 months, Wall Street expects Harley-Davidson’s full-year EPS of $4.12 to shrink by 12.1%.
Key Takeaways from Harley-Davidson’s Q3 Results
It was good to see Harley-Davidson beat analysts’ EPS expectations this quarter. We were also glad its number of motorcycles sold outperformed Wall Street’s estimates. On the other hand, its revenue missed. Overall, this quarter was mixed. The stock traded up 1.8% to $27.60 immediately following the results.
Is Harley-Davidson an attractive investment opportunity at the current price? If you’re making that decision, you should consider the bigger picture of valuation, business qualities, as well as the latest earnings. We cover that in our actionable full research report which you can read here, it’s free for active Edge members.


