Commercial real estate firm CBRE (NYSE: CBRE) missed Wall Street’s revenue expectations in Q3 2026, but sales rose 12.7% year on year to $11.52 billion. Its non-GAAP profit of $2.05 per share was 4.8% above analysts’ consensus estimates.
Is now the time to buy CBRE? Find out by accessing our full research report, it’s free.
CBRE (CBRE) Q3 2026 highlights:
- Revenue: $11.52 billion vs analyst estimates of $11.78 billion (12.7% year-on-year growth, 2.2% miss)
- Adjusted EPS: $2.05 vs analyst estimates of $1.96 (4.8% beat)
- Adjusted EBITDA: $1 billion vs analyst estimates of $973.9 million (8.7% margin, 2.8% beat)
- Operating Margin: 4.9%, in line with the same quarter last year
- Free Cash Flow Margin: 8%, similar to the same quarter last year
- Market Capitalization: $38.99 billion
“CBRE produced another quarter of strong financial results and continued to make strategic gains in targeted areas of our business,” said Bob Sulentic, CBRE’s chair and chief executive officer. “Financially, core earnings per share improved 28% on a 13% revenue increase, with both resilient(1) and transactional(1) businesses growing by double digits. Strategically, we continued to advance both our Critical Infrastructure Services business line as well as the broader infrastructure services work we perform across the company.”
Company overview
Established in 1906, CBRE (NYSE: CBRE) is one of the largest commercial real estate services firms in the world.
Revenue growth
Examining a company’s long-term performance can provide clues about its quality. Any business can put up a good quarter or two, but the best consistently grow over the long haul. Over the last five years, CBRE grew its sales at a 11.4% annual rate. Though this growth is acceptable on an absolute basis, we need to see more than just topline growth for the consumer discretionary sector, which can display significant earnings volatility. This means our bar for the sector is particularly high, reflecting the non-essential and hit-driven nature of the products and services offered. Additionally, five-year CAGR starts around Covid, when revenue was depressed then rebounded.
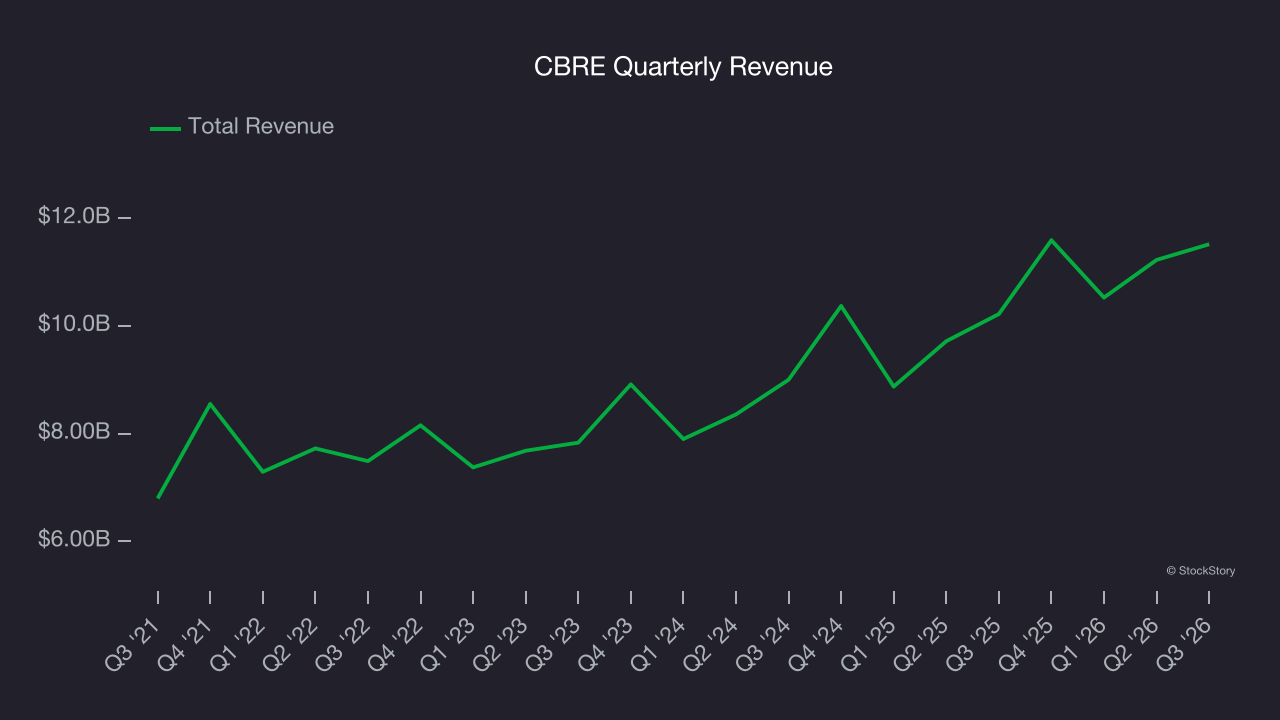
We at StockStory place the most emphasis on long-term growth, but within consumer discretionary, a stretched historical view may miss a company riding a successful new product or trend. CBRE’s annualized revenue growth of 14.6% over the last two years is above its five-year trend, which is encouraging. 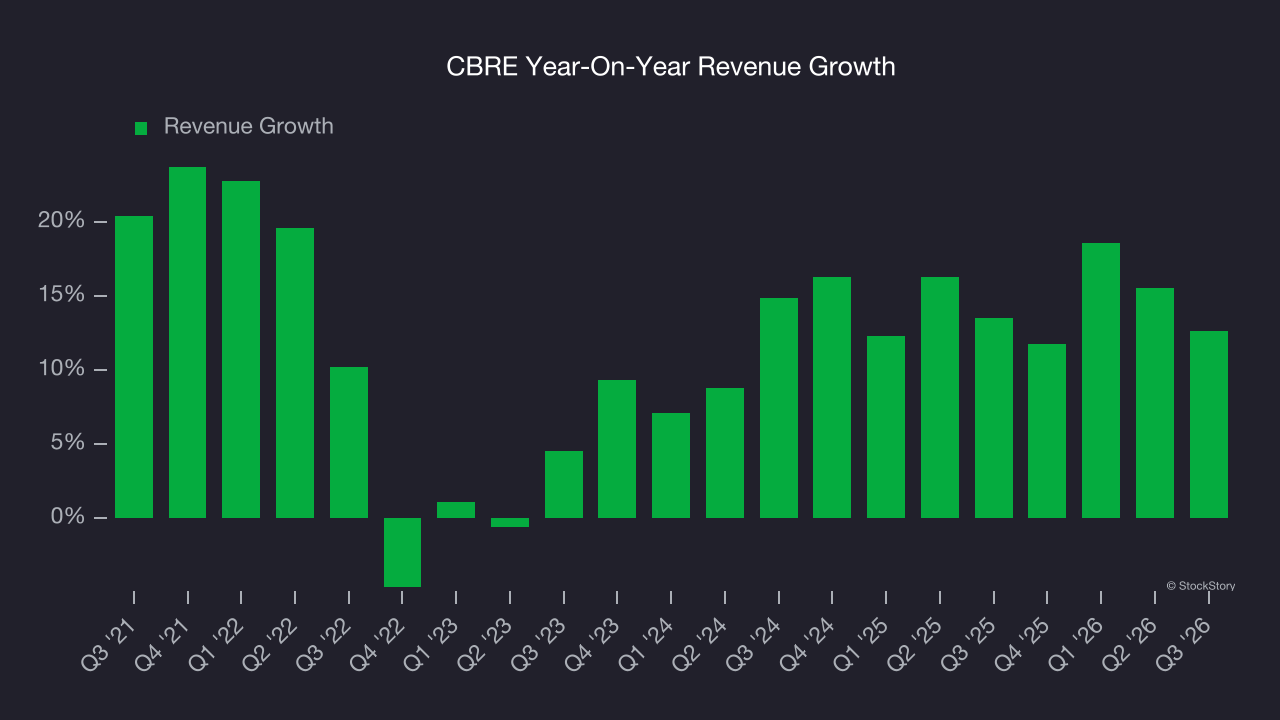
We can better understand the company’s revenue dynamics by analyzing its most important segment, Advisory Services. Over the last two years, CBRE’s Advisory Services revenue (leasing, capital markets) averaged 1.6% year-on-year growth. This segment has lagged the company’s overall sales. 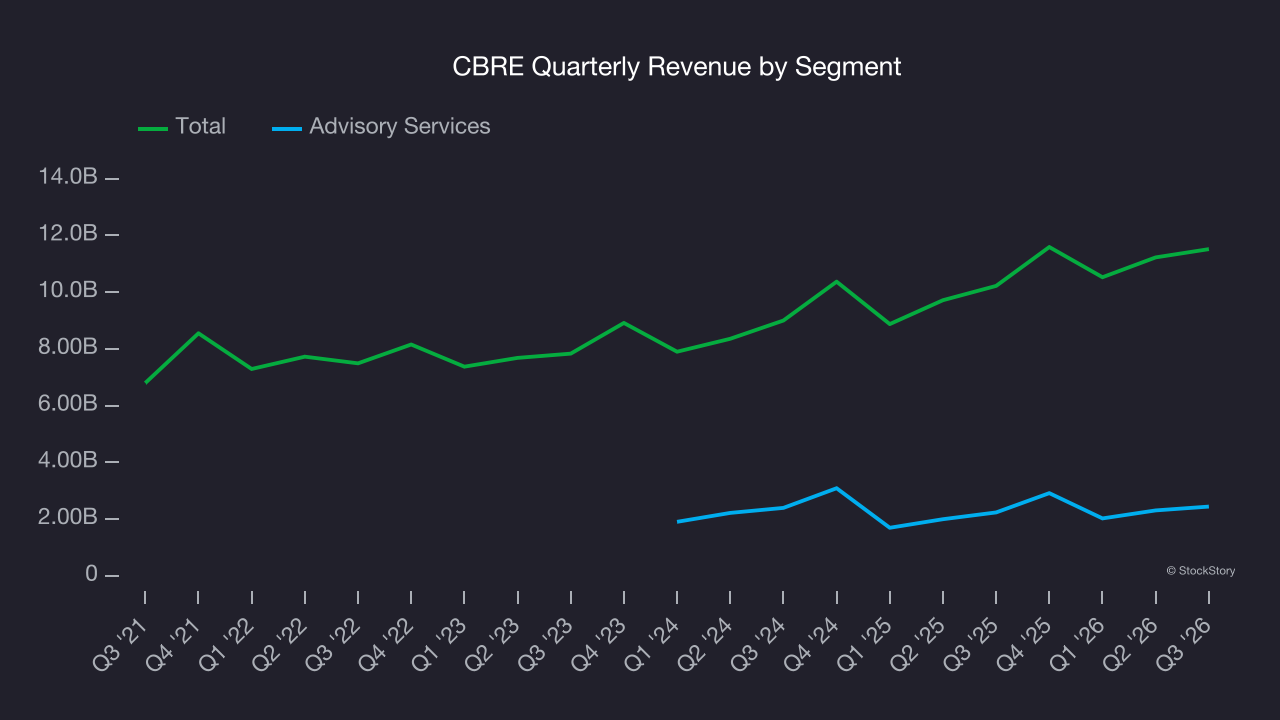
This quarter, CBRE’s revenue grew by 12.7% year on year to $11.52 billion but fell short of Wall Street’s estimates.
Looking ahead, sell-side analysts expect revenue to grow 13.3% over the next 12 months, similar to its two-year rate. We still think its growth trajectory is satisfactory given its scale and implies the market is forecasting success for its products and services.
WHILE YOU’RE HERE: The Next Palantir? One satellite company captures images of every point on Earth. Every single day. The Pentagon wants it. Hedge funds are using it to beat earnings. You’ve probably never heard of it.
This is what the early days of Palantir looked like before it became a giant. Same playbook. Different technology. If you missed Palantir, you need to see this. Claim The Stock Ticker for Free HERE.
Operating margin
CBRE’s operating margin has generally stayed the same over the last 12 months, and we generally like to see margin increases due to economies of scale and cost efficiency over time.
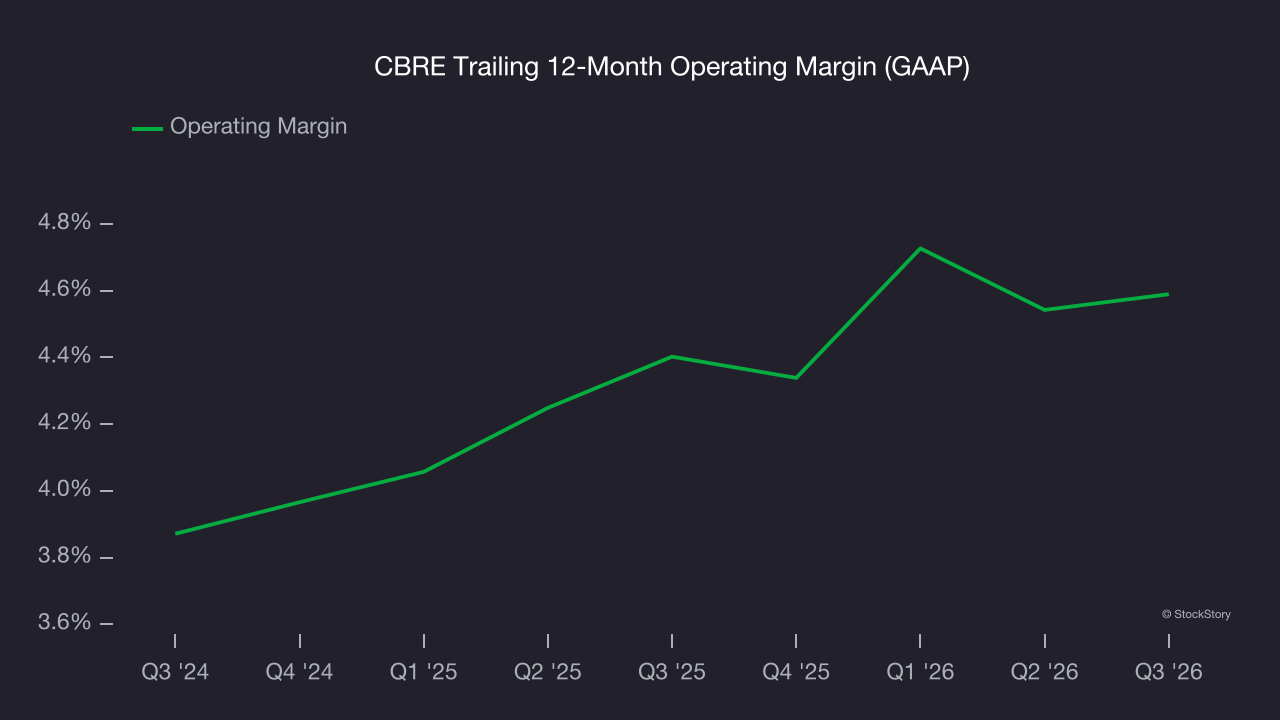
This quarter, CBRE generated an operating margin profit margin of 4.9%, in line with the same quarter last year. This indicates the company’s overall cost structure has been relatively stable.
Earnings per share
Revenue trends explain a company’s historical growth, but the long-term change in earnings per share (EPS) points to the profitability of that growth — for example, a company could inflate its sales through excessive spending on advertising and promotions.
CBRE’s weak 9.5% annual EPS growth over the last five years aligns with its revenue performance. This tells us it maintained its per-share profitability as it expanded.
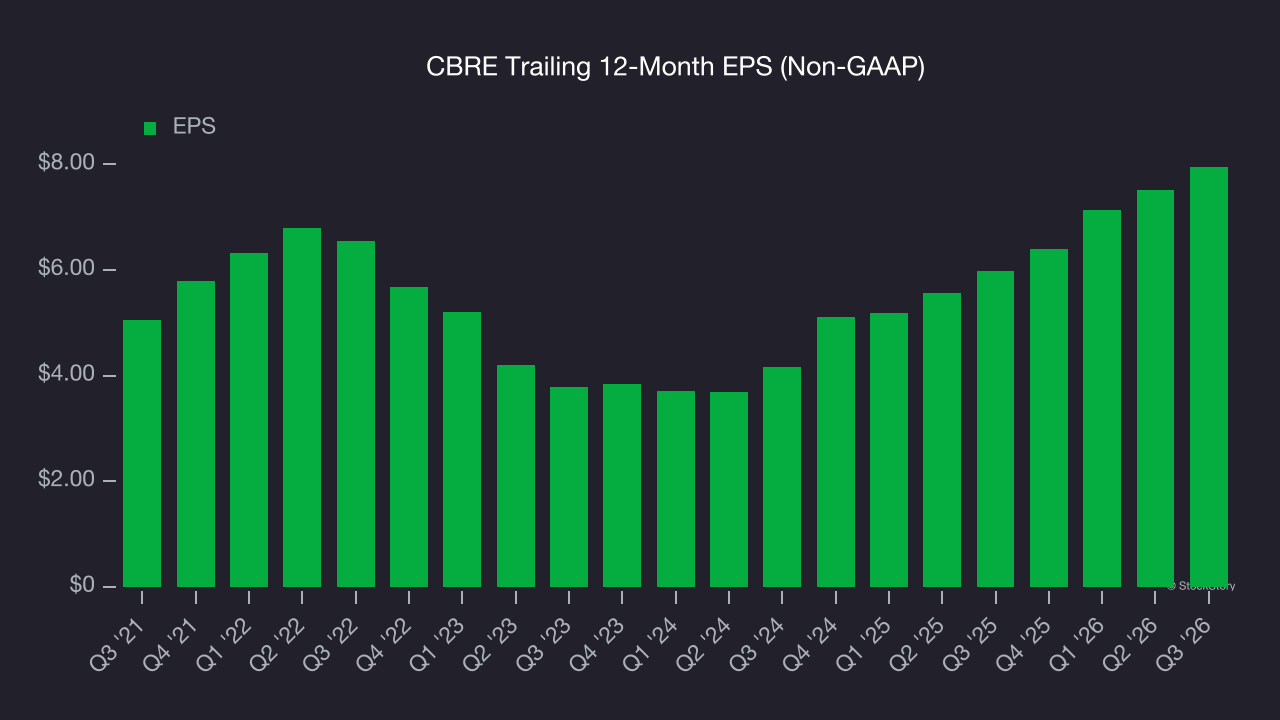
In Q3, CBRE reported adjusted EPS of $2.05, up from $1.61 in the same quarter last year. This print beat analysts’ estimates by 5%. Over the next 12 months, Wall Street expects CBRE’s full-year EPS to grow 4.7% from $7.95 to $8.32.
Key takeaways from CBRE’s Q3 results
It was good to see CBRE beat analysts’ EPS expectations this quarter. We were also happy its EBITDA outperformed Wall Street’s estimates. On the other hand, its revenue missed. Overall, this was a mixed quarter. The stock traded down 1.1% to $133.44 immediately following the results.
So should you invest in CBRE right now? What happened in the latest quarter matters, but not as much as longer-term business quality and valuation, when deciding whether to invest in this stock. We cover that in our actionable full research report which you can read here (it’s free).