Ceiling and wall solutions company Armstrong World Industries (NYSE: AWI) reported Q3 2026 results exceeding the market’s revenue expectations, with revenue up 11.9% year on year to $475.8 million. The company expects the full year’s revenue to be around $1.80 billion, close to analysts’ consensus estimates. Its non-GAAP profit of $2.26 per share was 5.3% below analysts’ consensus estimates.
For more on Armstrong World, read our free full research report.
Armstrong World (AWI) Q3 2026 highlights:
- Revenue $475.8 million vs S&P analysts’ consensus estimates of $473 million (11.9% year-on-year growth, 0.6% beat)
- Adjusted EPS $2.26 vs S&P analysts’ consensus estimates of $2.39 (5.3% miss)
- Adjusted EBITDA $164 million vs analysts’ consensus estimates of $170.1 million (34.5% margin, 3.6% miss)
- Revenue guidance The company slightly lifted its revenue guidance for the full year to $1.80 billion at the midpoint from $1.79 billion
- Adjusted EPS guidance Management lowered its full-year adjusted EPS guidance to $8.35 at the midpoint, a 0.6% decrease
- EBITDA guidance $607 million at the midpoint for the full year, below analysts’ consensus estimates of $613.2 million
- Operating margin 27.6%, in line with the same quarter last year
- Free cash flow margin 22.3%, down from 23.6% in the same quarter last year
- Market capitalization $6.97 billion
"Strong demand for our broad portfolio of Architectural Specialties solutions and solid Mineral Fiber AUV and volume performance drove another quarter of record top-line results. In relatively stable end market conditions, our growth initiatives continue to enable us to deliver profitable growth ahead of the market," said AWI President and CEO, Mark Hershey. "Despite rapidly rising inflationary pressures, as well as timing-related mix headwinds impacting Mineral Fiber sales, our teams delivered double-digit adjusted EBITDA growth along with adjusted EBITDA margin expansion in both segments. Across the enterprise, we have responded to accelerating cost pressures, while remaining squarely focused on delivering our updated full-year outlook and advancing our attractive growth initiatives."
Revenue growth
A company’s long-term revenue performance is one signal of its overall quality. Any business can have short-term success, but a top-tier one grows for years. Over the last five years, Armstrong World grew its revenue at a solid 10.4% compounded annual growth rate. Its growth surpassed the average industrials company and shows its offerings resonate with customers.
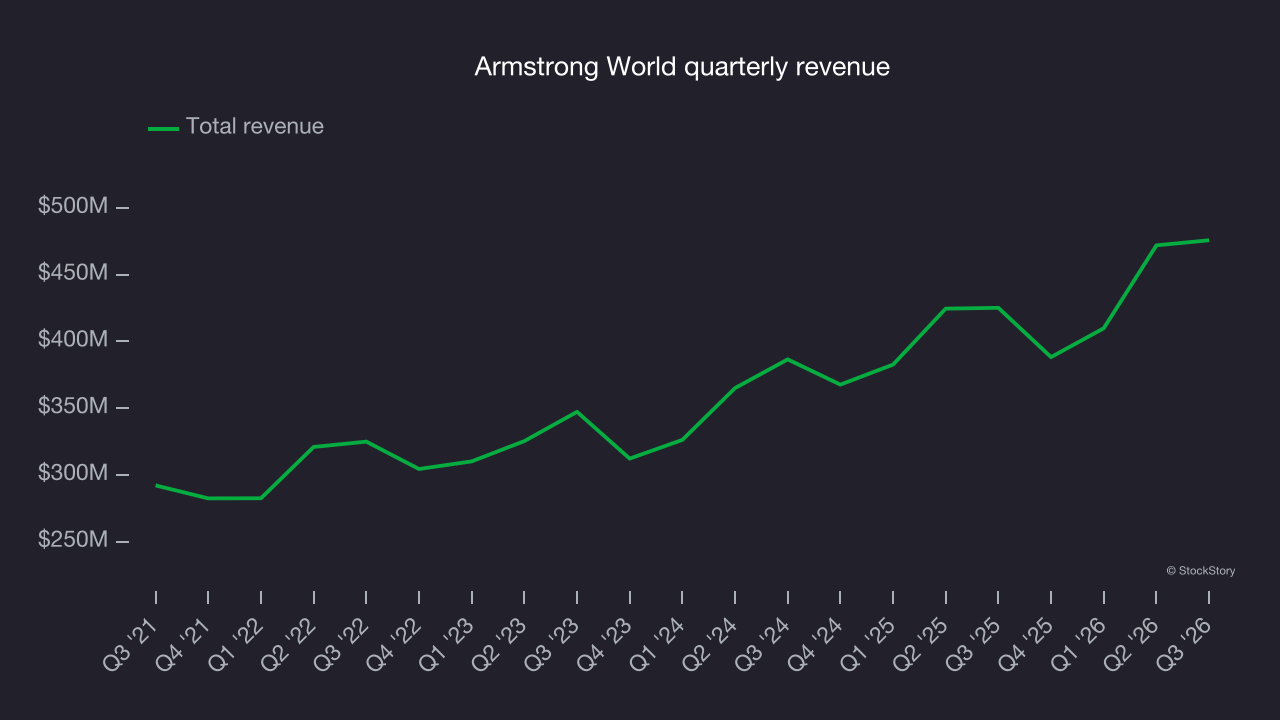
Long-term growth matters most, but within industrials, a half-decade historical view may miss cycles, industry trends or a company capitalizing on catalysts such as a new contract win or a successful product line. Armstrong World’s annualized revenue growth of 12.1% over the last two years is above its five-year trend, suggesting its demand was strong and recently accelerated. 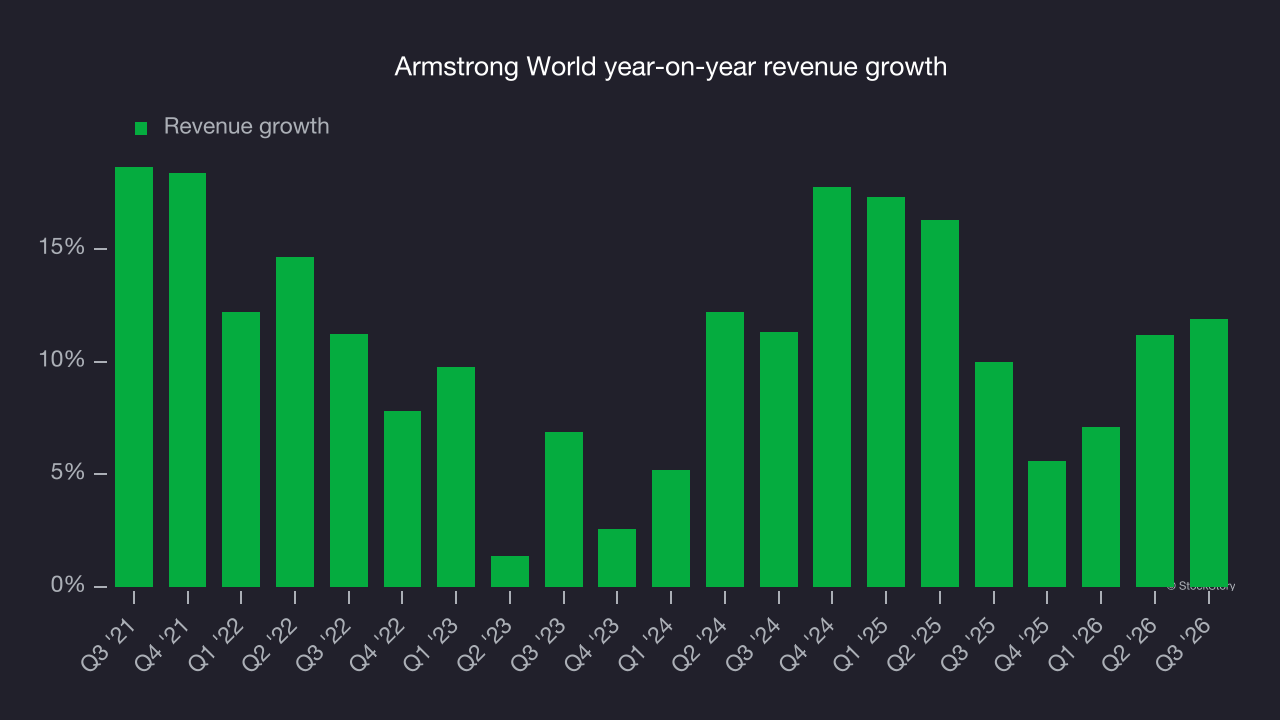
This quarter, Armstrong World reported year-on-year revenue growth of 11.9%, and its $475.8 million of revenue exceeded Wall Street’s consensus estimates by 0.6%.
Looking ahead, sell-side analysts expect revenue to grow 8.1% over the next 12 months, according to S&P, a deceleration versus the last two years. Despite the slowdown, this projection is above the sector average and indicates the market is factoring in some success for its newer products and services.
Operating margin
Operating margin is a key measure of profitability. Think of it as net income, the bottom line, excluding the impact of taxes and interest on debt, which are less connected to business fundamentals.
Armstrong World has performed well over the last five years. It demonstrated high profitability for an industrials business, with an average operating margin of 25.2%. This result is unsurprising given its favorable gross margin baseline.
Armstrong World’s operating margin rose by 4.1 percentage points over the last five years, as its revenue growth provided operating leverage.
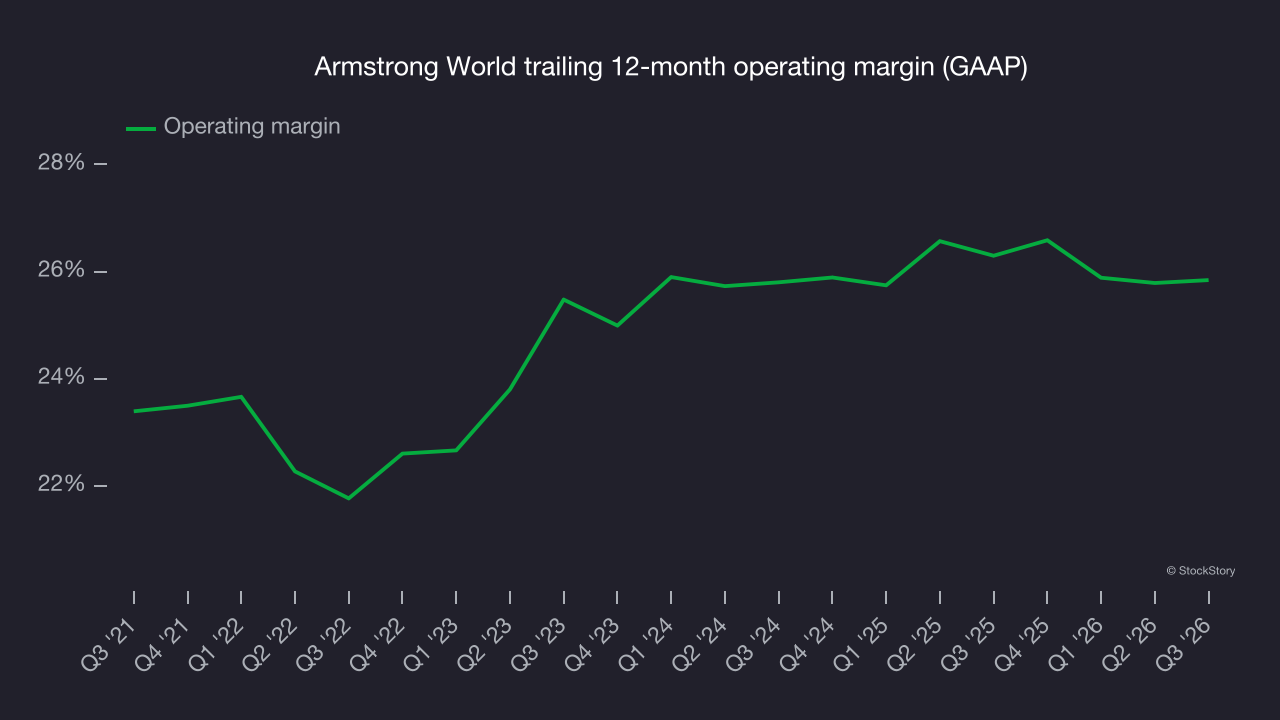
This quarter, Armstrong World generated an operating margin of 27.6%, in line with the same quarter last year. This indicates the company’s cost structure has recently been stable.
Earnings per share
We track the long-term change in earnings per share (EPS) for the same reason as long-term revenue growth. Compared to revenue, however, EPS highlights whether a company’s growth is profitable.
Armstrong World’s EPS grew at a 15% compounded annual growth rate over the last five years, higher than its 10.4% annualized revenue growth. This tells us the company became more profitable on a per-share basis as it expanded.
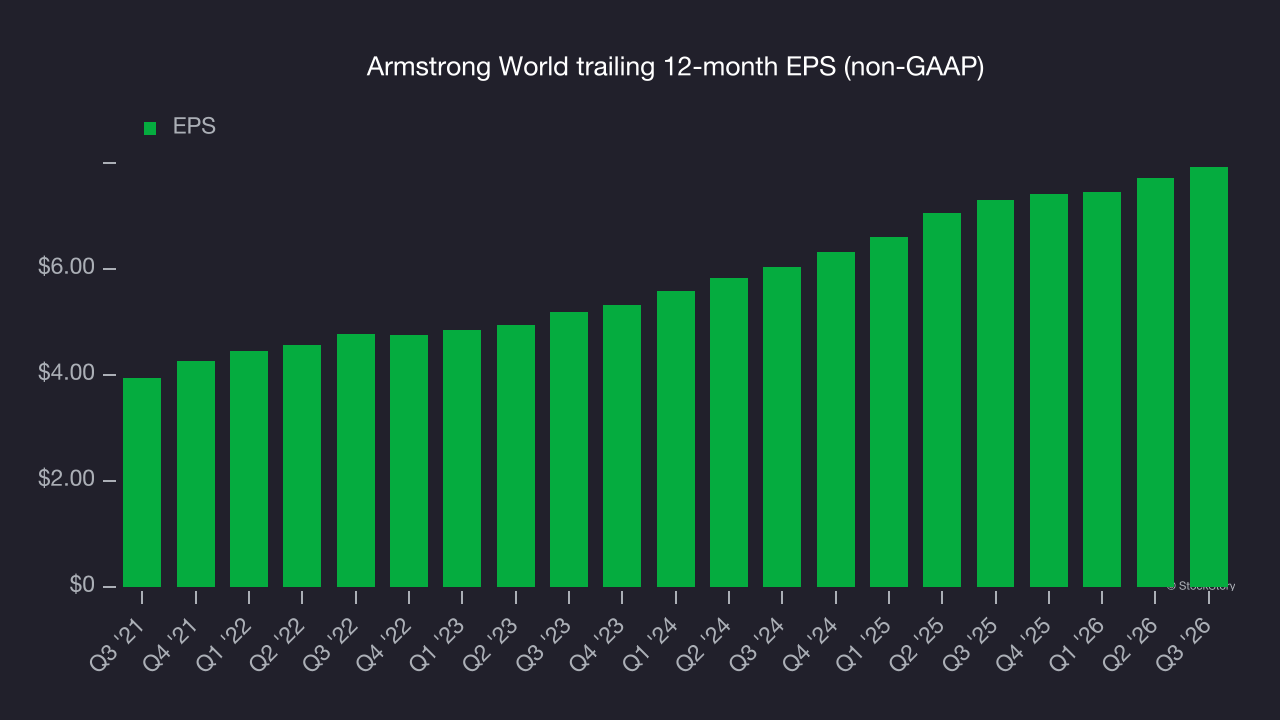
A closer look at Armstrong World’s earnings helps explain its performance. As mentioned earlier, Armstrong World’s operating margin was flat this quarter but expanded by 4.1 percentage points over the last five years. In addition, its share count shrank by 11.5%. These are positive signs for shareholders because improving profitability and share buybacks boost EPS growth relative to revenue growth. 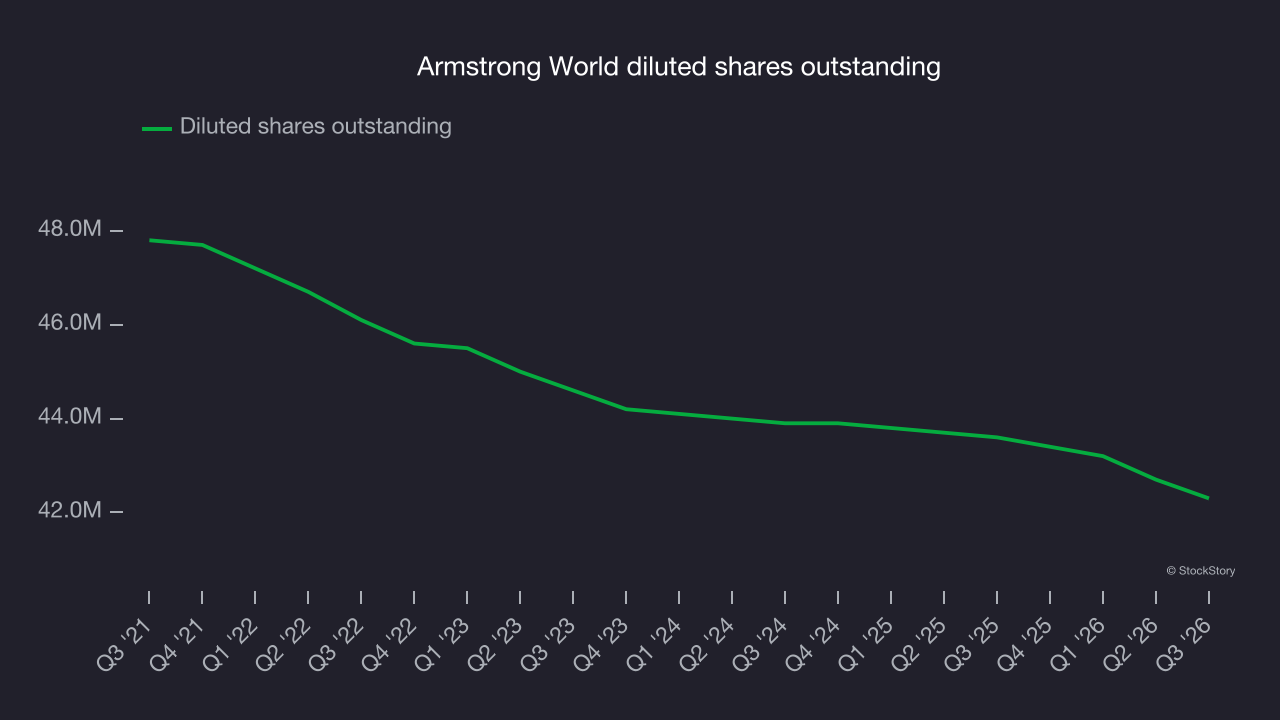
As with revenue, we analyze EPS over a shorter period to see if we are missing a change in the business.
For Armstrong World, its two-year annual EPS growth of 14.6% is similar to its five-year trend, implying strong and stable earnings power.
In Q3, Armstrong World reported adjusted EPS of $2.26, up from $2.05 in the same quarter last year. Despite growing year on year, this result missed analysts’ consensus estimates, but long-term adjusted EPS growth matters more than short-term movements. Over the next 12 months, Wall Street expects Armstrong World’s full-year EPS to grow 18.3% from $7.92 to $9.37, according to S&P.
Key takeaways from Armstrong World’s Q3 results
Armstrong World’s narrow revenue beat and full-year revenue guidance in line with Wall Street’s consensus were positives, but EPS and EBITDA missed consensus estimates, making this a softer quarter overall. Shares tumbled 5.7% to $155.61 immediately after the results.
Armstrong World’s latest earnings report disappointed. One quarter doesn’t define a company’s quality. To assess the stock at its current price, consider the bigger picture of valuation and business quality, as well as the latest earnings. Read more in our full research report here (it’s free).