
Insurance brokerage firm Brown & Brown (NYSE: BRO) met Wall Street’s revenue expectations in Q1 CY2026, with sales up 35.4% year on year to $1.90 billion. Its non-GAAP profit of $1.39 per share was 2.3% above analysts’ consensus estimates.
Is now the time to buy Brown & Brown? Find out by accessing our full research report, it’s free.
Brown & Brown (BRO) Q1 CY2026 Highlights:
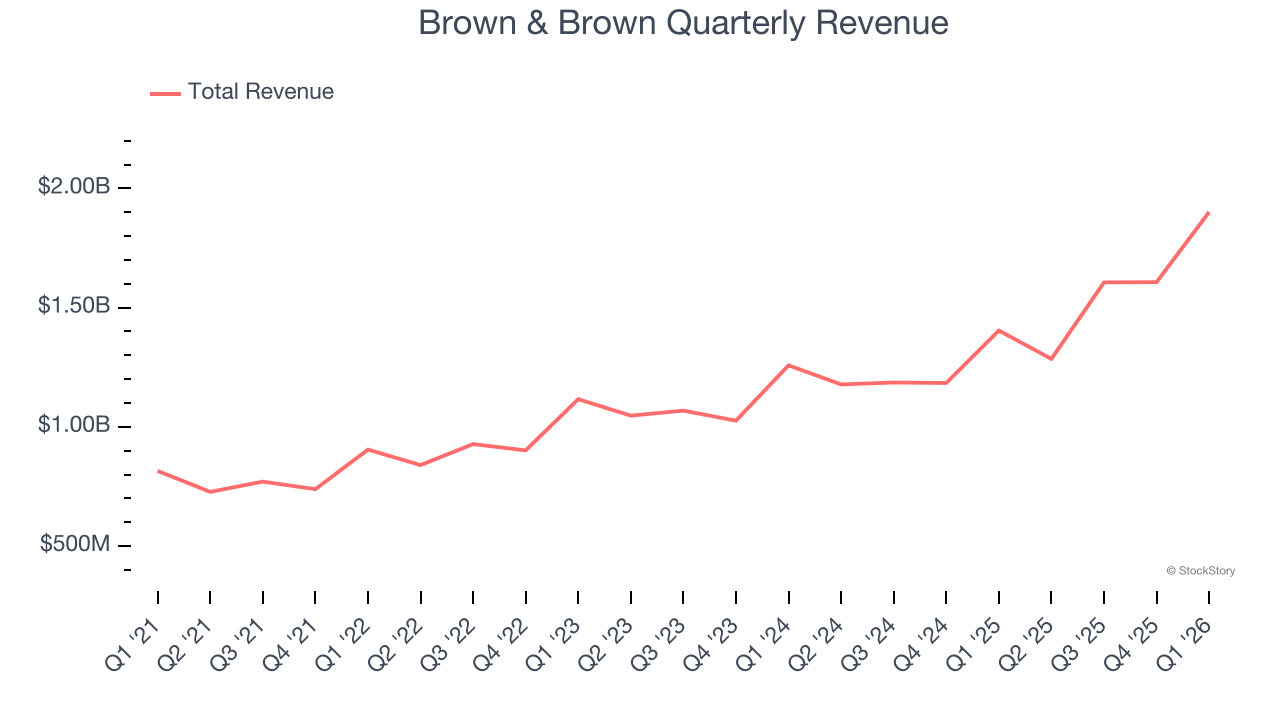
- Revenue: $1.90 billion vs analyst estimates of $1.89 billion (35.4% year-on-year growth, in line)
- Adjusted EPS: $1.39 vs analyst estimates of $1.36 (2.3% beat)
- Adjusted EBITDA: $731 million vs analyst estimates of $711.1 million (38.5% margin, 2.8% beat)
- Operating Margin: 37.1%, up from 30.4% in the same quarter last year
- Free Cash Flow Margin: 12.7%, down from 14% in the same quarter last year
- Organic Revenue was flat year on year (miss)
- Market Capitalization: $22.38 billion
Company Overview
With roots dating back to 1939 and operations spanning 44 U.S. states and 14 countries, Brown & Brown (NYSE: BRO) is an insurance brokerage and risk management firm that markets and sells insurance products across property, casualty, and employee benefits sectors.
Revenue Growth
A company’s long-term sales performance can indicate its overall quality. Even a bad business can shine for one or two quarters, but a top-tier one grows for years.
With $6.40 billion in revenue over the past 12 months, Brown & Brown is one of the larger companies in the business services industry and benefits from a well-known brand that influences purchasing decisions.
As you can see below, Brown & Brown’s sales grew at an incredible 18.6% compounded annual growth rate over the last five years. This is a great starting point for our analysis because it shows Brown & Brown’s demand was higher than many business services companies.
Long-term growth is the most important, but within business services, a half-decade historical view may miss new innovations or demand cycles. Brown & Brown’s annualized revenue growth of 20.6% over the last two years is above its five-year trend, suggesting its demand was strong and recently accelerated. 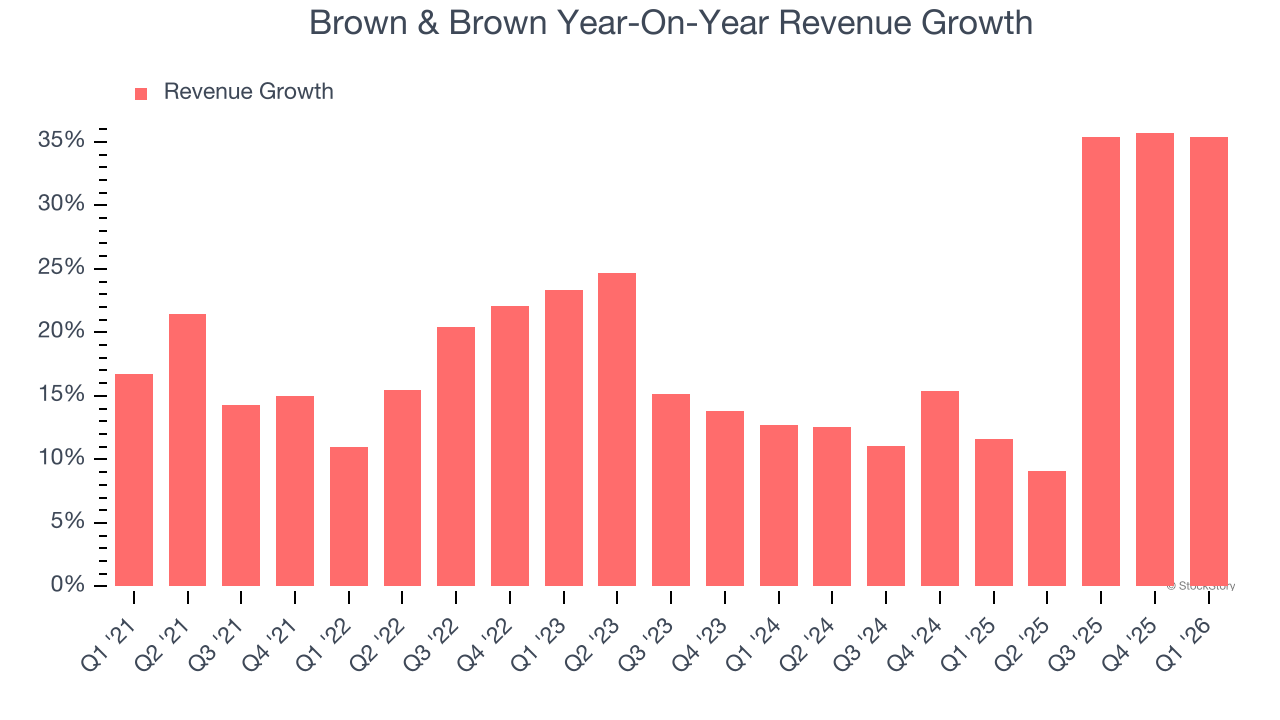
We can better understand the company’s sales dynamics by analyzing its organic revenue, which strips out one-time events like acquisitions and currency fluctuations that don’t accurately reflect its fundamentals. Over the last two years, Brown & Brown’s organic revenue averaged 5.5% year-on-year growth. Because this number is lower than its two-year revenue growth, we can see that some mixture of acquisitions and foreign exchange rates boosted its headline results. 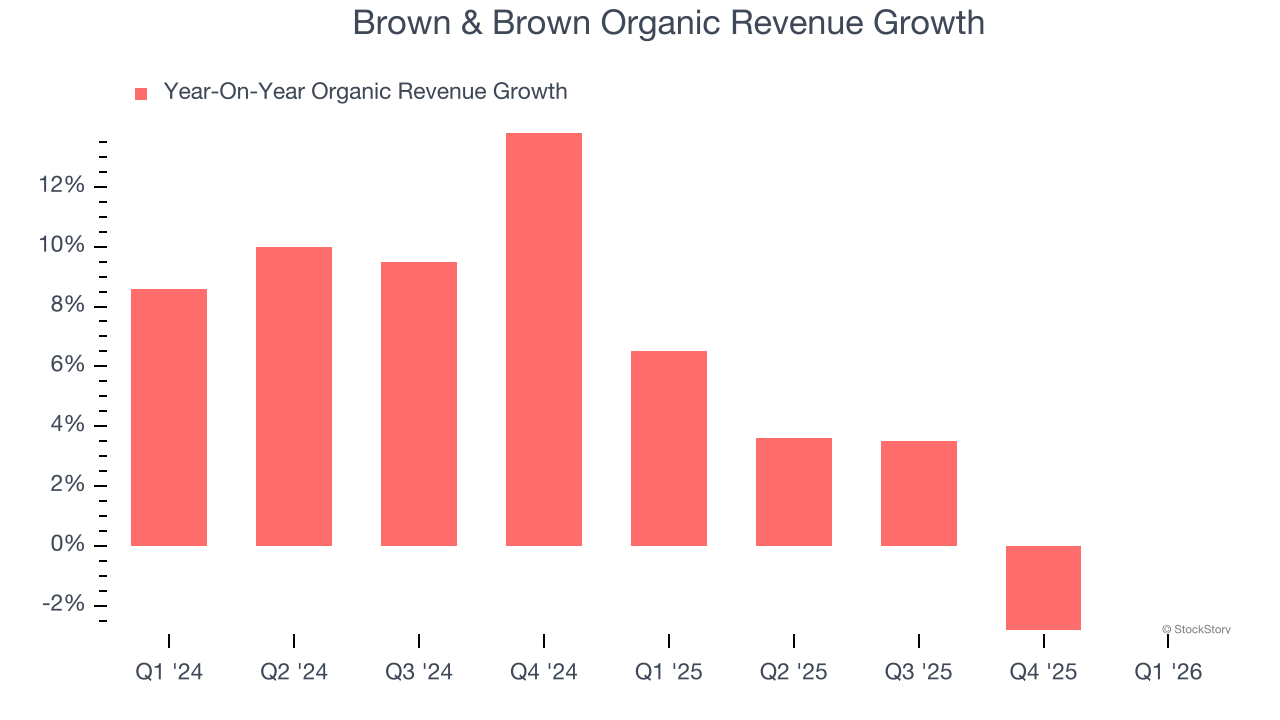
This quarter, Brown & Brown’s year-on-year revenue growth of 35.4% was wonderful, and its $1.90 billion of revenue was in line with Wall Street’s estimates.
Looking ahead, sell-side analysts expect revenue to grow 13.6% over the next 12 months, a deceleration versus the last two years. Still, this projection is healthy and indicates the market is baking in success for its products and services.
ONE MORE THING: 3 Hidden Platforms Growing 3X Faster than Amazon, Google, and PayPal. Amazon, Google, and Meta all followed the same playbook: Dominate an ignored market. Build an unbeatable moat. Scale until you’re unstoppable.
These three platforms are running that exact playbook right now. The early investors in Amazon made fortunes. The early investors in these could do the same. Get All 3 Stocks Here for FREE.
Adjusted Operating Margin
Brown & Brown has been a well-oiled machine over the last five years. It demonstrated elite profitability for a business services business, boasting an average adjusted operating margin of 26.2%.
Looking at the trend in its profitability, Brown & Brown’s adjusted operating margin rose by 1.1 percentage points over the last five years, as its sales growth gave it operating leverage.
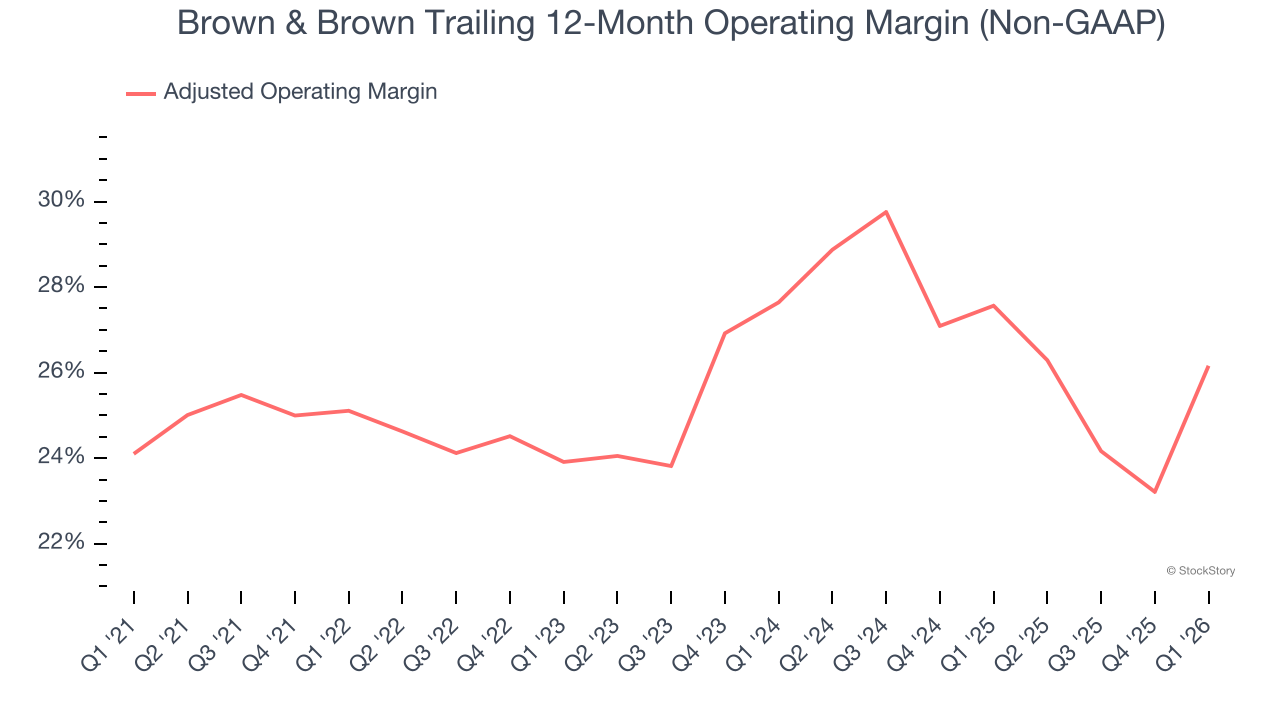
This quarter, Brown & Brown generated an adjusted operating margin profit margin of 38.5%, up 8 percentage points year on year. This increase was a welcome development and shows it was more efficient.
Earnings Per Share
Revenue trends explain a company’s historical growth, but the long-term change in earnings per share (EPS) points to the profitability of that growth – for example, a company could inflate its sales through excessive spending on advertising and promotions.
Brown & Brown’s astounding 18.5% annual EPS growth over the last five years aligns with its revenue performance. This tells us its incremental sales were profitable.
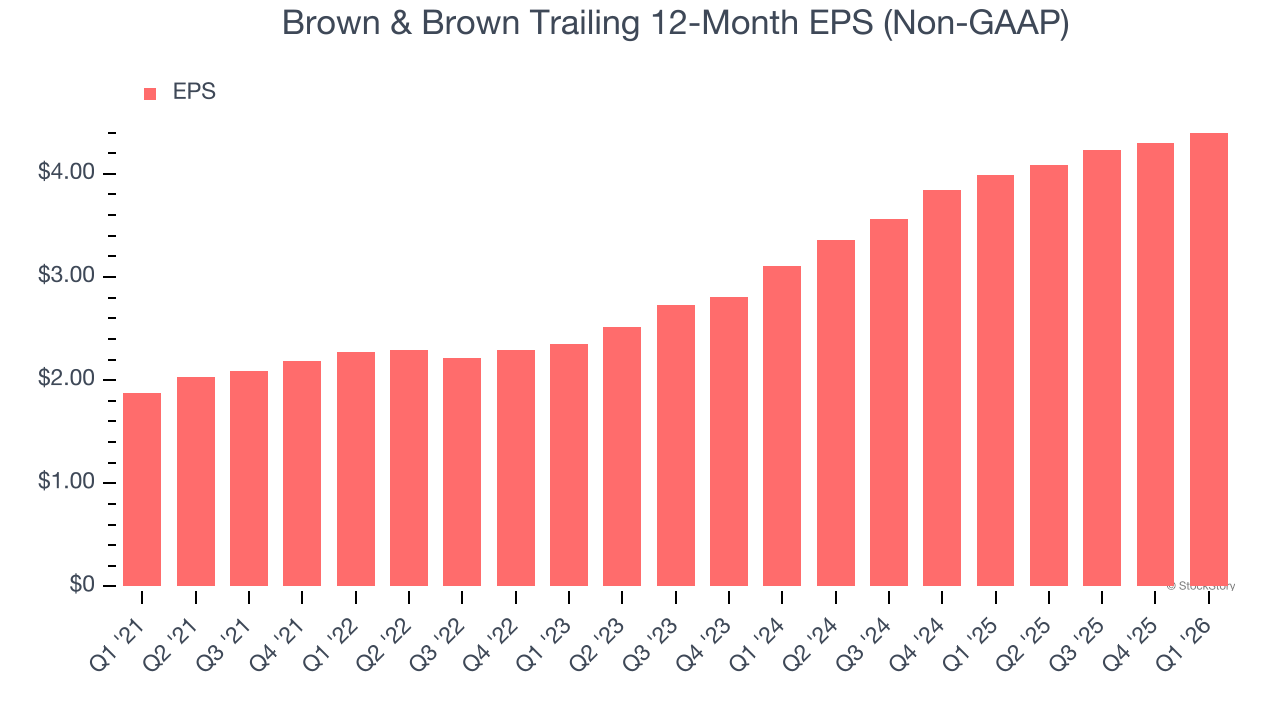
Like with revenue, we analyze EPS over a shorter period to see if we are missing a change in the business.
For Brown & Brown, its two-year annual EPS growth of 18.9% is similar to its five-year trend, implying strong and stable earnings power.
In Q1, Brown & Brown reported adjusted EPS of $1.39, up from $1.29 in the same quarter last year. This print beat analysts’ estimates by 2.3%. Over the next 12 months, Wall Street expects Brown & Brown’s full-year EPS of $4.40 to grow 5.7%.
Key Takeaways from Brown & Brown’s Q1 Results
It was good to see Brown & Brown beat analysts’ EPS expectations this quarter. On the other hand, its organic revenue missed. Overall, this was a softer quarter. The stock remained flat at $66.05 immediately following the results.
Brown & Brown’s latest earnings report disappointed. One quarter doesn’t define a company’s quality, so let’s explore whether the stock is a buy at the current price. When making that decision, it’s important to consider its valuation, business qualities, as well as what has happened in the latest quarter. We cover that in our actionable full research report which you can read here (it’s free).


