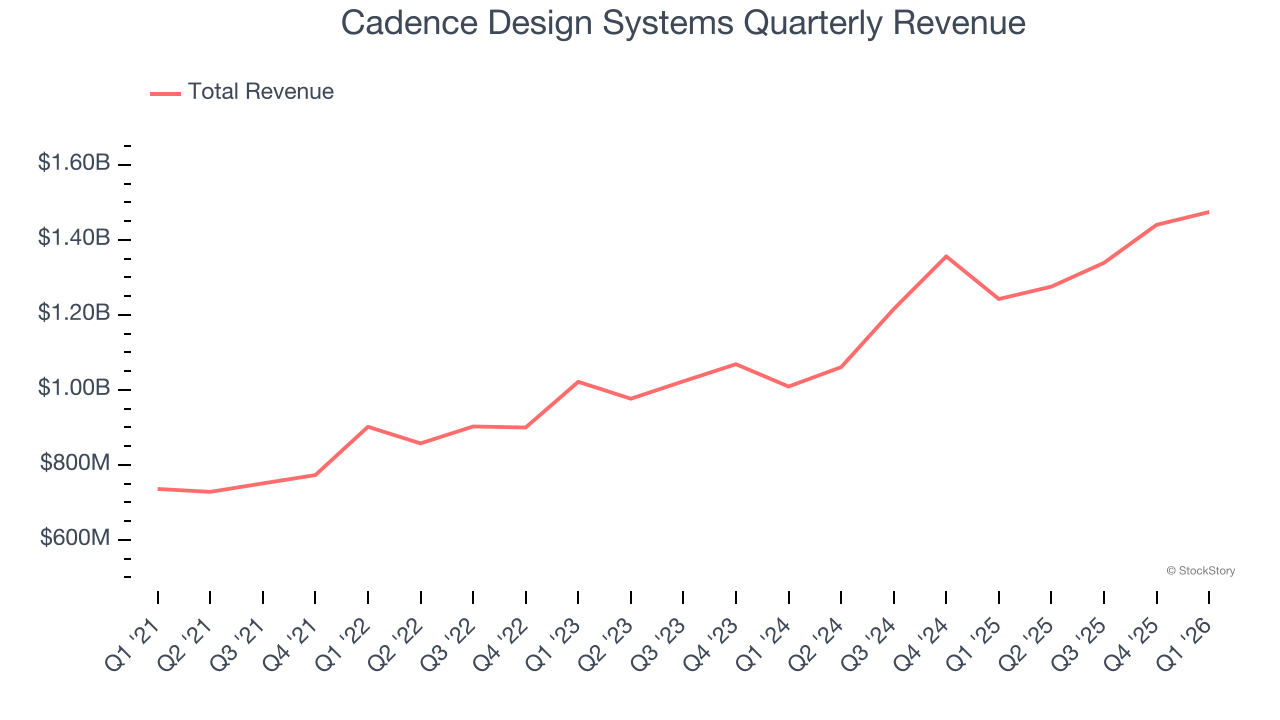
Electronic design automation company Cadence Design Systems (NASDAQ: CDNS) reported Q1 CY2026 results topping the market’s revenue expectations, with sales up 18.7% year on year to $1.47 billion. The company’s full-year revenue guidance of $6.18 billion at the midpoint came in 0.7% above analysts’ estimates. Its non-GAAP profit of $1.96 per share was 4% above analysts’ consensus estimates.
Is now the time to buy Cadence Design Systems? Find out by accessing our full research report, it’s free.
Cadence Design Systems (CDNS) Q1 CY2026 Highlights:
- Revenue: $1.47 billion vs analyst estimates of $1.45 billion (18.7% year-on-year growth, 1.9% beat)
- Adjusted EPS: $1.96 vs analyst estimates of $1.89 (4% beat)
- Adjusted Operating Income: $569.5 million vs analyst estimates of $636.5 million (38.6% margin, 10.5% miss)
- The company lifted its revenue guidance for the full year to $6.18 billion at the midpoint from $5.95 billion, a 3.8% increase
- Management lowered its full-year Adjusted EPS guidance to $7.90 at the midpoint, a 2.5% decrease
- Operating Margin: 29.3%, in line with the same quarter last year
- Free Cash Flow Margin: 20.8%, down from 35.6% in the previous quarter
- Billings: $1.49 billion at quarter end, up 21.4% year on year
- Market Capitalization: $91.91 billion
“Cadence had a strong start to 2026, delivering a solid Q1 with accelerating AI demand and record backlog, reflecting strong customer commitment to our AI-driven portfolio,” said Anirudh Devgan, president and chief executive officer.
Company Overview
Powering the chips behind everything from smartphones to AI accelerators for over 35 years, Cadence Design Systems (NASDAQ: CDNS) provides essential computational software, hardware, and intellectual property used by engineers to design and verify advanced electronic systems and semiconductors.
Revenue Growth
Reviewing a company’s long-term sales performance reveals insights into its quality. Any business can experience short-term success, but top-performing ones enjoy sustained growth for years. Over the last five years, Cadence Design Systems grew its sales at a 14.6% annual rate. Though this growth is acceptable on an absolute basis, we need to see more than just topline growth for the software sector, which can display significant earnings volatility. This means our bar for the sector is particularly high, reflecting the non-essential and hit-driven nature of the products and services offered. Additionally, five-year CAGR starts around Covid, when revenue was depressed then rebounded.
Long-term growth is the most important, but within software, a half-decade historical view may miss new innovations or demand cycles. Cadence Design Systems’s annualized revenue growth of 16.4% over the last two years is above its five-year trend, suggesting some bright spots. 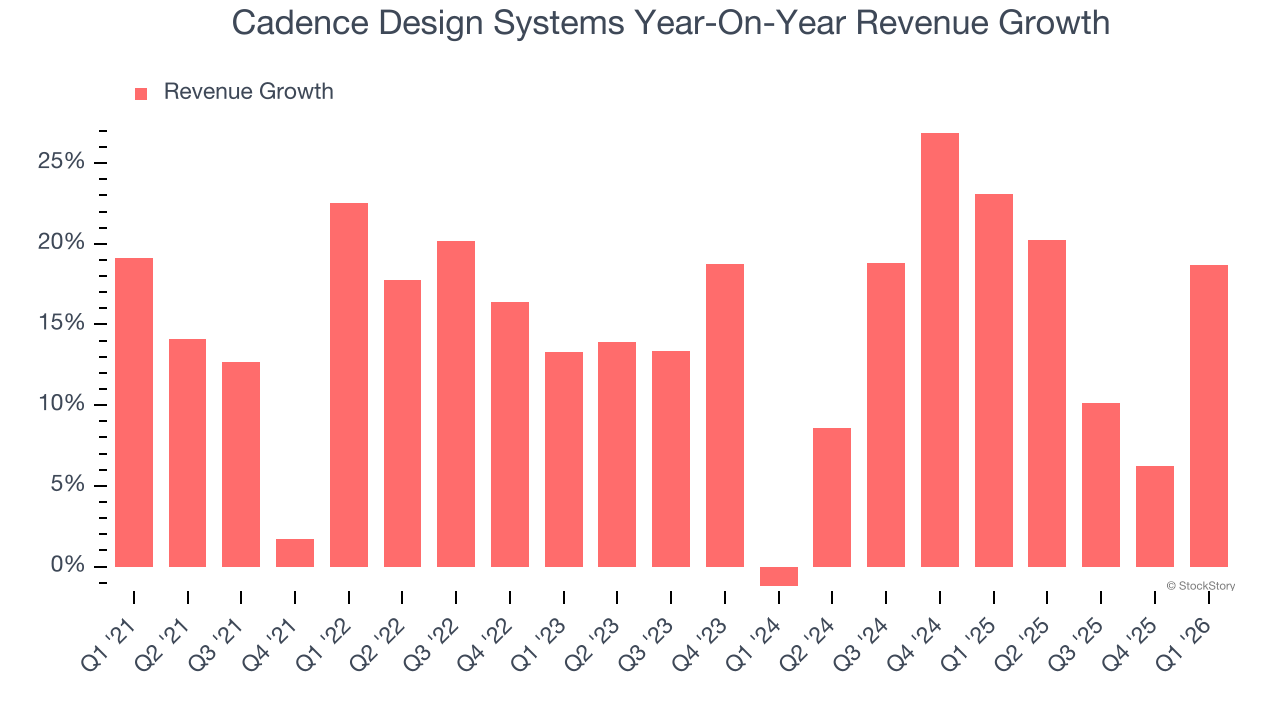
This quarter, Cadence Design Systems reported year-on-year revenue growth of 18.7%, and its $1.47 billion of revenue exceeded Wall Street’s estimates by 1.9%.
Looking ahead, sell-side analysts expect revenue to grow 12.6% over the next 12 months, a deceleration versus the last two years. This projection is underwhelming and suggests its products and services will face some demand challenges.
WHILE YOU’RE HERE: The Next Palantir? One satellite company captures images of every point on Earth. Every single day. The Pentagon wants it. Hedge funds are using it to beat earnings. You’ve probably never heard of it.
This is what the early days of Palantir looked like before it became a $437 billion giant. Same playbook. Different technology. If you missed Palantir, you need to see this. Claim The Stock Ticker for Free HERE.
Billings
Billings is a non-GAAP metric that is often called “cash revenue” because it shows how much money the company has collected from customers in a certain period. This is different from revenue, which must be recognized in pieces over the length of a contract.
Cadence Design Systems’s billings came in at $1.49 billion in Q1, and over the last four quarters, its growth slightly lagged the sector as it averaged 14.1% year-on-year increases. This performance mirrored its total sales and suggests that increasing competition is causing challenges in acquiring/retaining customers. 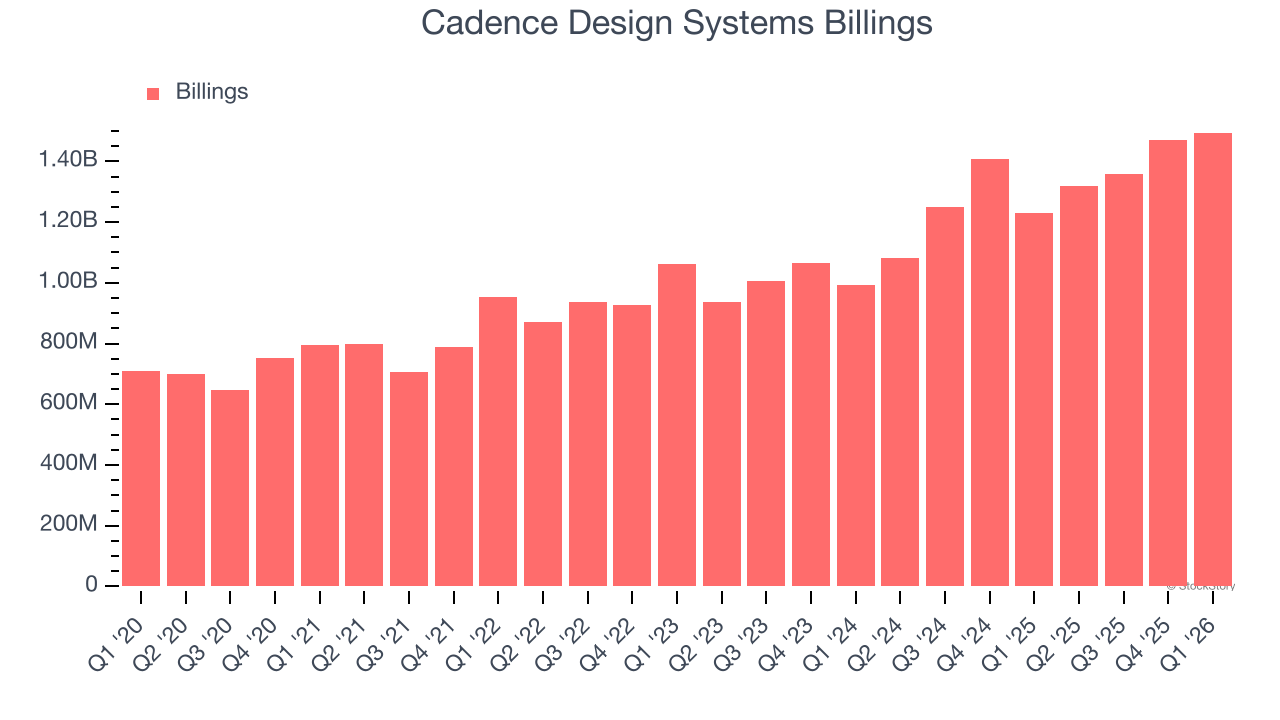
Customer Acquisition Efficiency
The customer acquisition cost (CAC) payback period represents the months required to recover the cost of acquiring a new customer. Essentially, it’s the break-even point for sales and marketing investments. A shorter CAC payback period is ideal, as it implies better returns on investment and business scalability.
Cadence Design Systems is extremely efficient at acquiring new customers, and its CAC payback period checked in at 15 months this quarter. The company’s rapid recovery of its customer acquisition costs means it can attempt to spur growth by increasing its sales and marketing investments.
Key Takeaways from Cadence Design Systems’s Q1 Results
We enjoyed seeing Cadence Design Systems beat analysts’ billings expectations this quarter. We were also happy its revenue outperformed Wall Street’s estimates. Overall, this print had some key positives. The market seemed to be hoping for more, and the stock traded down 1.4% to $334.06 immediately following the results.
Big picture, is Cadence Design Systems a buy here and now? When making that decision, it’s important to consider its valuation, business qualities, as well as what has happened in the latest quarter. We cover that in our actionable full research report which you can read here (it’s free).