

Industrial conglomerate Crane (NYSE: CR) reported Q1 CY2026 results exceeding the market’s revenue expectations, with sales up 24.9% year on year to $696.4 million. Its non-GAAP profit of $1.65 per share was 14% above analysts’ consensus estimates.
Is now the time to buy Crane? Find out by accessing our full research report, it’s free.
Crane (CR) Q1 CY2026 Highlights:
- Revenue: $696.4 million vs analyst estimates of $671 million (24.9% year-on-year growth, 3.8% beat)
- Adjusted EPS: $1.65 vs analyst estimates of $1.45 (14% beat)
- Adjusted EBITDA: $150 million vs analyst estimates of $133.4 million (21.5% margin, 12.5% beat)
- Management raised its full-year Adjusted EPS guidance to $6.75 at the midpoint, a 1.5% increase
- Operating Margin: 14.4%, down from 18.1% in the same quarter last year
- Free Cash Flow was -$40.2 million compared to -$60.4 million in the same quarter last year
- Organic Revenue rose 3.8% year on year (beat)
- Market Capitalization: $10.4 billion
Alex Alcala, Crane's President and Chief Executive Officer, stated: "We delivered a very strong start to 2026, generating 15% adjusted EPS growth in the first quarter. Results exceeded our expectations with the majority of our outperformance driven by outstanding execution and momentum across our recent acquisitions which are already contributing meaningfully to earnings growth. Our legacy business also performed well, with nearly 4% core sales growth and solid operating leverage.
Company Overview
Based in Connecticut, Crane (NYSE: CR) is a diversified manufacturer of engineered industrial products, including fluid handling, and aerospace technologies.
Revenue Growth
Reviewing a company’s long-term sales performance reveals insights into its quality. Any business can have short-term success, but a top-tier one grows for years. Over the last five years, Crane’s demand was weak and its revenue declined by 3% per year. This wasn’t a great result, but there are still things to like about Crane.
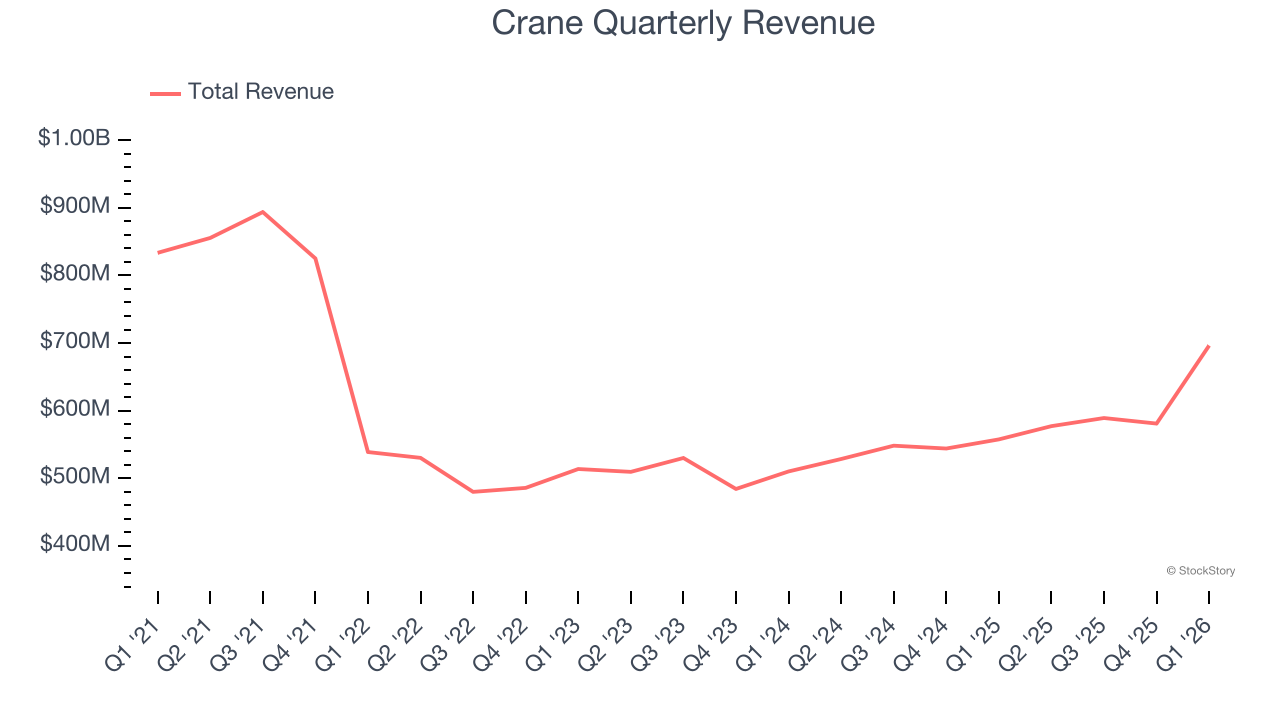
We at StockStory place the most emphasis on long-term growth, but within industrials, a half-decade historical view may miss cycles, industry trends, or a company capitalizing on catalysts such as a new contract win or a successful product line. Crane’s annualized revenue growth of 9.6% over the last two years is above its five-year trend, suggesting its demand recently accelerated. 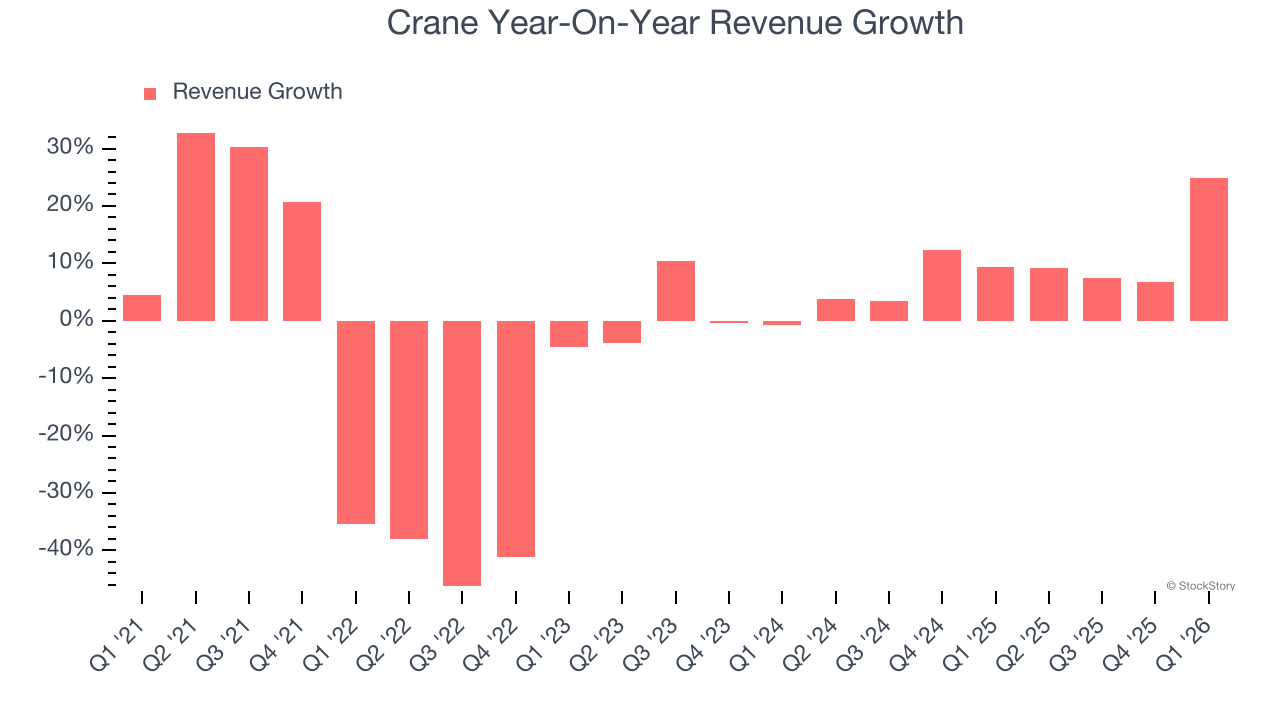
We can better understand the company’s sales dynamics by analyzing its organic revenue, which strips out one-time events like acquisitions and currency fluctuations that don’t accurately reflect its fundamentals. Over the last two years, Crane’s organic revenue averaged 6.5% year-on-year growth. Because this number is lower than its two-year revenue growth, we can see that some mixture of acquisitions and foreign exchange rates boosted its headline results. 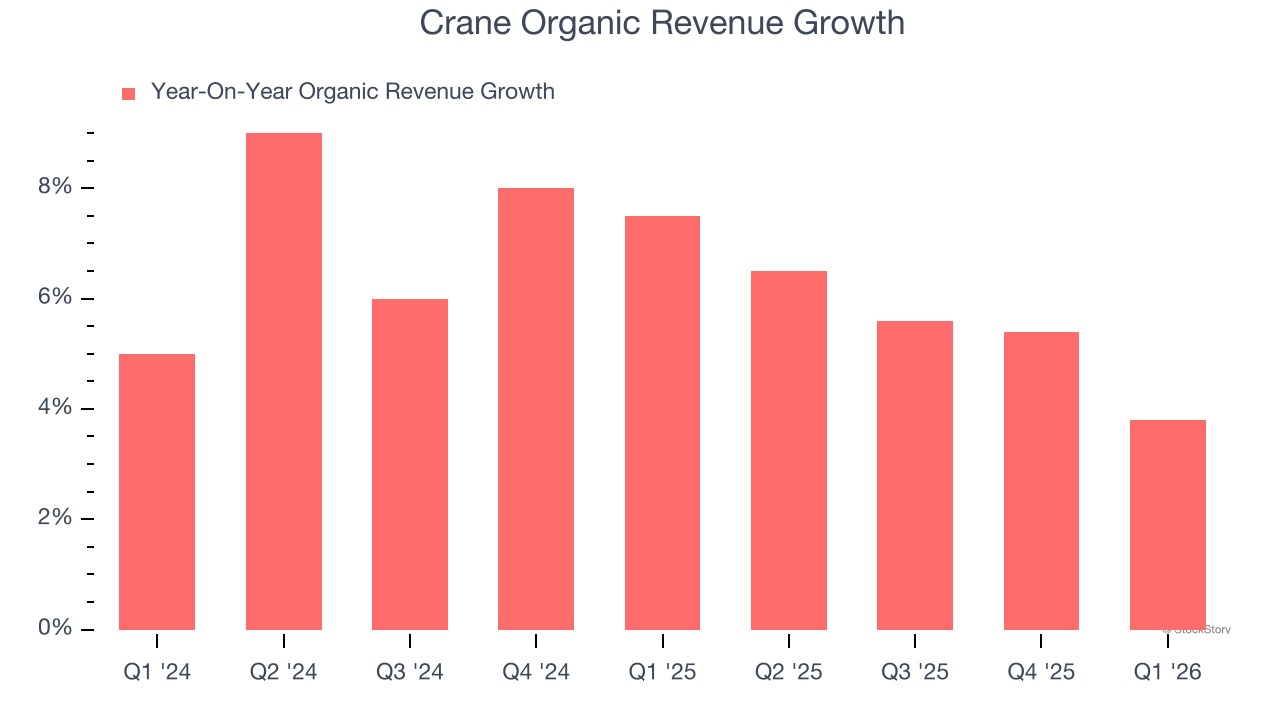
This quarter, Crane reported robust year-on-year revenue growth of 24.9%, and its $696.4 million of revenue topped Wall Street estimates by 3.8%.
Looking ahead, sell-side analysts expect revenue to grow 19% over the next 12 months, an improvement versus the last two years. This projection is eye-popping and suggests its newer products and services will fuel better top-line performance.
ALSO WORTH WATCHING: Nvidia’s Quiet Partner. Nvidia’s chips cost a hundred grand. The connectors that make them work cost even more. One company makes them all.
Every AI server needs specialized infrastructure the chip companies don’t make. High-speed cables. Power connectors. Thermal sensors. This 90-year-old company built a monopoly on it. The AI boom just started. This stock is still flying under the radar. Claim The Stock Ticker Here for FREE.
Operating Margin
Crane has been an efficient company over the last five years. It was one of the more profitable businesses in the industrials sector, boasting an average operating margin of 13.5%. This result isn’t surprising as its high gross margin gives it a favorable starting point.
Analyzing the trend in its profitability, Crane’s operating margin rose by 2.8 percentage points over the last five years, showing its efficiency has improved.
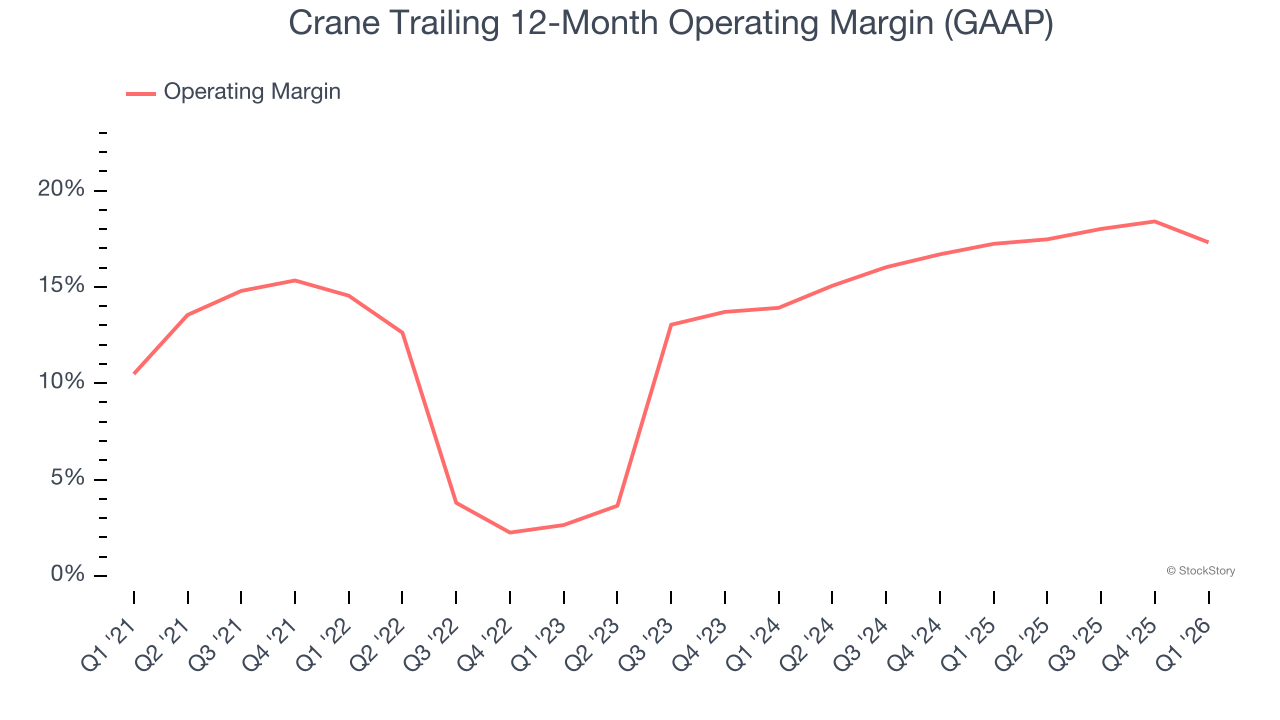
This quarter, Crane generated an operating margin profit margin of 14.4%, down 3.8 percentage points year on year. Since Crane’s operating margin decreased more than its gross margin, we can assume it was less efficient because expenses such as marketing, R&D, and administrative overhead increased.
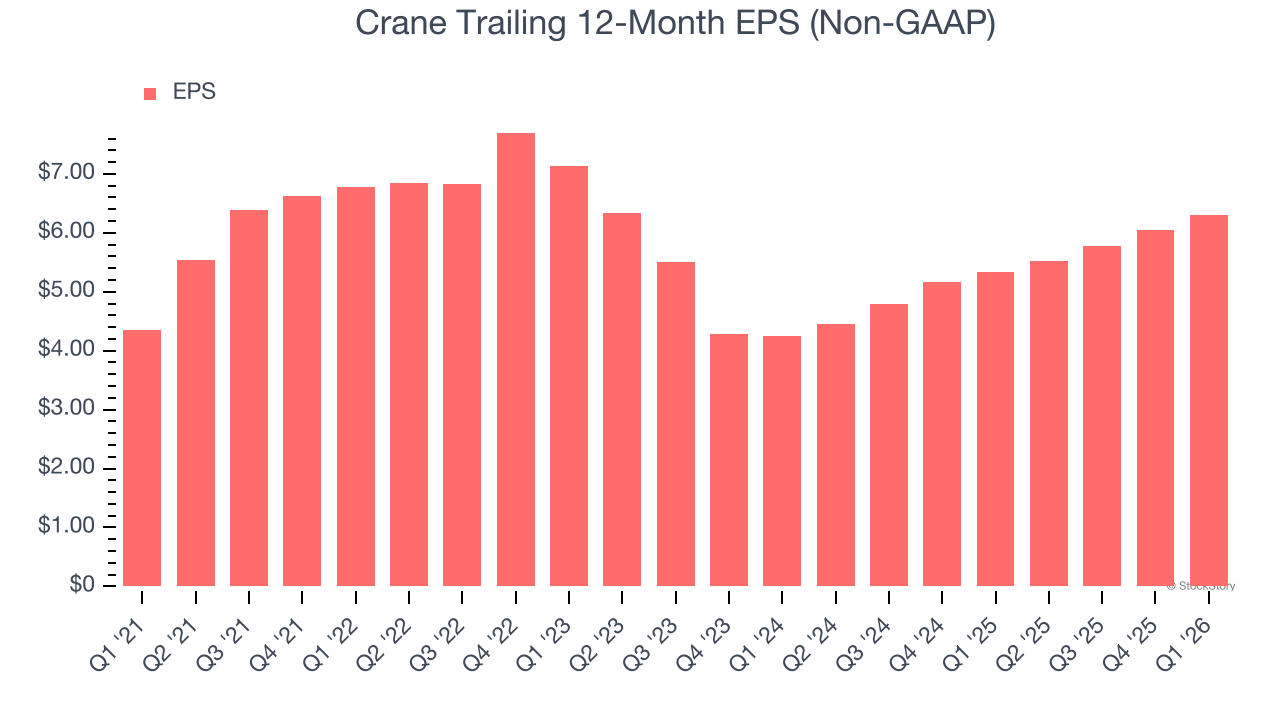
Earnings Per Share
Revenue trends explain a company’s historical growth, but the long-term change in earnings per share (EPS) points to the profitability of that growth – for example, a company could inflate its sales through excessive spending on advertising and promotions.
Crane’s EPS grew at 7.7% compounded annual growth rate over the last five years. On the bright side, this performance was better than its 3% annualized revenue declines and tells us management adapted its cost structure in response to a challenging demand environment.
Diving into the nuances of Crane’s earnings can give us a better understanding of its performance. As we mentioned earlier, Crane’s operating margin declined this quarter but expanded by 2.8 percentage points over the last five years. This was the most relevant factor (aside from the revenue impact) behind its higher earnings; interest expenses and taxes can also affect EPS but don’t tell us as much about a company’s fundamentals.
Like with revenue, we analyze EPS over a shorter period to see if we are missing a change in the business.
For Crane, its two-year annual EPS growth of 21.8% was higher than its five-year trend. This acceleration made it one of the faster-growing industrials companies in recent history.
In Q1, Crane reported adjusted EPS of $1.65, up from $1.39 in the same quarter last year. This print easily cleared analysts’ estimates, and shareholders should be content with the results. Over the next 12 months, Wall Street expects Crane’s full-year EPS of $6.31 to grow 9.9%.
Key Takeaways from Crane’s Q1 Results
We were impressed by how significantly Crane blew past analysts’ EBITDA expectations this quarter. We were also excited its revenue outperformed Wall Street’s estimates by a wide margin. On the other hand, its adjusted operating income missed. Overall, we think this was a solid quarter with some key areas of upside. The stock traded up 6.6% to $195.00 immediately following the results.
Sure, Crane had a solid quarter, but if we look at the bigger picture, is this stock a buy? The latest quarter does matter, but not nearly as much as longer-term fundamentals and valuation, when deciding if the stock is a buy. We cover that in our actionable full research report which you can read here (it’s free).


