
Financial intelligence company S&P Global (NYSE: SPGI) missed Wall Street’s revenue expectations in Q1 CY2026 as sales rose 3.7% year on year to $3.92 billion. Its non-GAAP profit of $4.30 per share was 10.7% below analysts’ consensus estimates.
Is now the time to buy S&P Global? Find out by accessing our full research report, it’s free.
S&P Global (SPGI) Q1 CY2026 Highlights:
- Revenue: $3.92 billion vs analyst estimates of $4.07 billion (3.7% year-on-year growth, 3.8% miss)
- Pre-tax Profit: $1.63 billion (41.6% margin)
- Adjusted EPS: $4.30 vs analyst expectations of $4.82 (10.7% miss)
- Management raised its full-year Adjusted EPS guidance to $19.53 at the midpoint, a 10.2% increase
- Market Capitalization: $129.4 billion
Company Overview
Tracing its roots back to 1860 when it published the first railroad industry manual, S&P Global (NYSE: SPGI) provides credit ratings, market intelligence, commodity data, automotive analytics, and financial indices that help investors and businesses make decisions.
Revenue Growth
A company’s long-term sales performance is one signal of its overall quality. Any business can put up a good quarter or two, but the best consistently grow over the long haul. Regrettably, S&P Global’s revenue grew at a mediocre 6.2% compounded annual growth rate over the last five years. This wasn’t a great result compared to the rest of the financials sector, but there are still things to like about S&P Global.
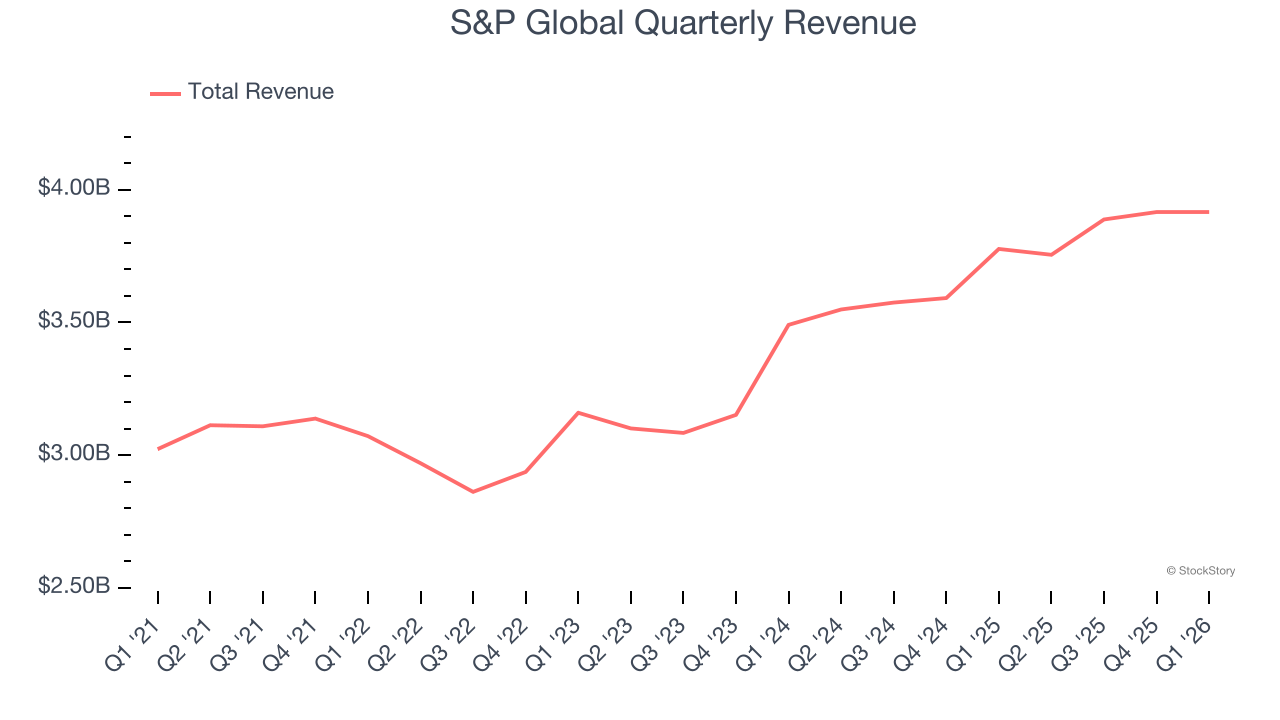
Long-term growth is the most important, but within financials, a half-decade historical view may miss recent interest rate changes and market returns. S&P Global’s annualized revenue growth of 9.8% over the last two years is above its five-year trend, suggesting some bright spots. 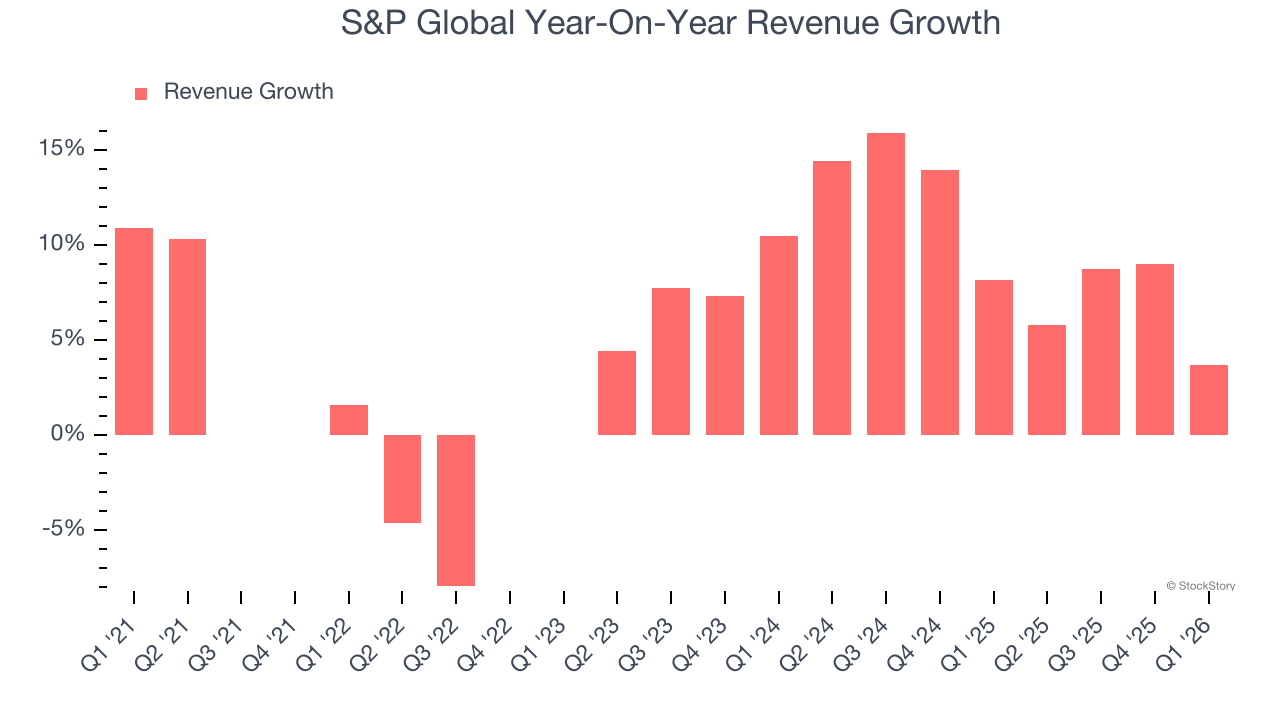 Note: Quarters not shown were determined to be outliers, impacted by outsized investment gains/losses that are not indicative of the recurring fundamentals of the business.
This quarter, S&P Global’s revenue grew by 3.7% year on year to $3.92 billion, falling short of Wall Street’s estimates.
ONE MORE THING: 3 Hidden Platforms Growing 3X Faster than Amazon, Google, and PayPal. Amazon, Google, and Meta all followed the same playbook: Dominate an ignored market. Build an unbeatable moat. Scale until you’re unstoppable.
These three platforms are running that exact playbook right now. The early investors in Amazon made fortunes. The early investors in these could do the same. Get All 3 Stocks Here for FREE.
Key Takeaways from S&P Global’s Q1 Results
We struggled to find many positives in these results. Its revenue missed and its EPS fell short of Wall Street’s estimates. Overall, this was a softer quarter. The stock remained flat at $440.73 immediately following the results.
So should you invest in S&P Global right now? What happened in the latest quarter matters, but not as much as longer-term business quality and valuation, when deciding whether to invest in this stock. We cover that in our actionable full research report which you can read here (it’s free).