

Modular flooring manufacturer Interface (NASDAQ: TILE) announced better-than-expected revenue in Q1 CY2026, with sales up 11.3% year on year to $331 million. The company expects next quarter’s revenue to be around $390 million, close to analysts’ estimates. Its non-GAAP profit of $0.41 per share was 24.2% above analysts’ consensus estimates.
Is now the time to buy Interface? Find out by accessing our full research report, it’s free.
Interface (TILE) Q1 CY2026 Highlights:
- Revenue: $331 million vs analyst estimates of $319.8 million (11.3% year-on-year growth, 3.5% beat)
- Adjusted EPS: $0.41 vs analyst estimates of $0.33 (24.2% beat)
- Adjusted EBITDA: $46.8 million vs analyst estimates of $40.81 million (14.1% margin, 14.7% beat)
- The company lifted its revenue guidance for the full year to $1.47 billion at the midpoint from $1.44 billion, a 1.7% increase
- Operating Margin: 9.8%, up from 7.8% in the same quarter last year
- Free Cash Flow Margin: 1%, similar to the same quarter last year
- Market Capitalization: $1.61 billion
“We delivered a strong start to 2026, with currency-neutral net sales growth of 7% and adjusted earnings per diluted share growth of 64%, reflecting consistent execution and continued momentum across the business,” commented Laurel Hurd, CEO of Interface.
Company Overview
Pioneering carbon-neutral flooring since its founding in 1973, Interface (NASDAQ: TILE) is a global manufacturer of modular carpet tiles, luxury vinyl tile (LVT), and rubber flooring that specializes in carbon-neutral and sustainable flooring solutions.
Revenue Growth
Reviewing a company’s long-term sales performance reveals insights into its quality. Any business can put up a good quarter or two, but many enduring ones grow for years.
With $1.42 billion in revenue over the past 12 months, Interface is a mid-sized business services company, which sometimes brings disadvantages compared to larger competitors benefiting from better economies of scale. On the bright side, it can still flex high growth rates because it’s working from a smaller revenue base.
As you can see below, Interface’s 5.9% annualized revenue growth over the last five years was decent. This shows its offerings generated slightly more demand than the average business services company, a helpful starting point for our analysis.
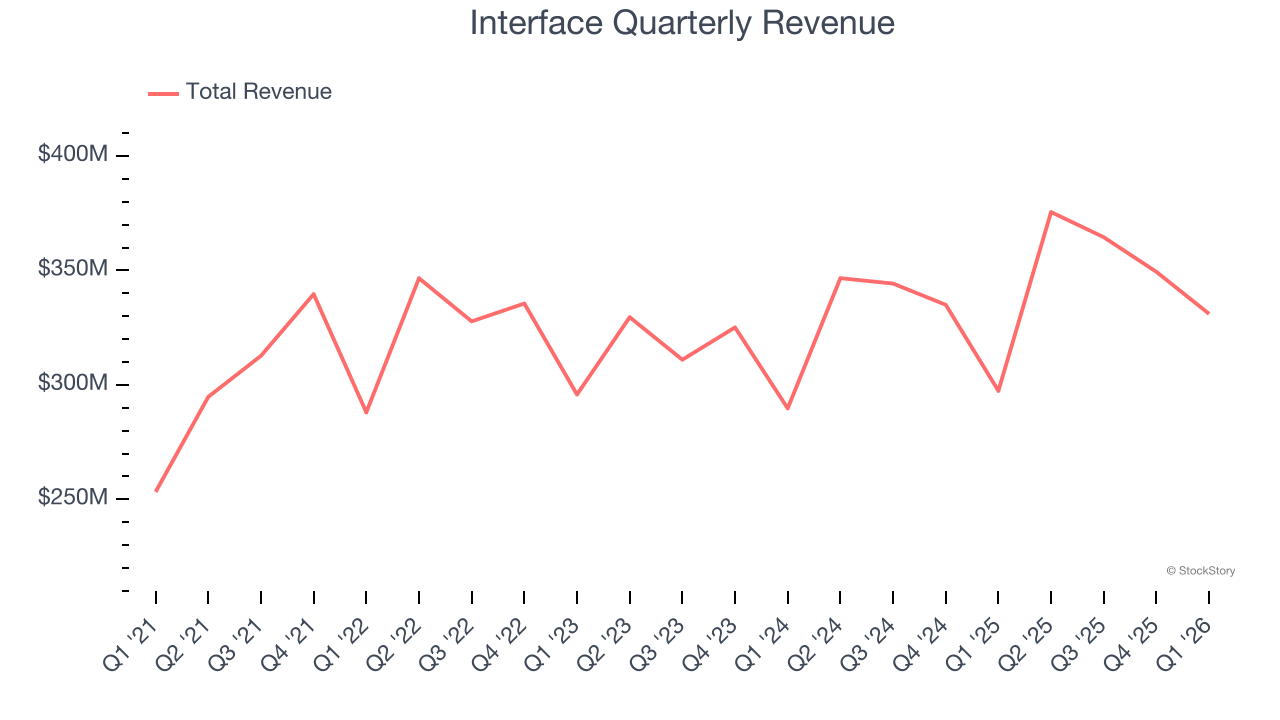
Long-term growth is the most important, but within business services, a half-decade historical view may miss new innovations or demand cycles. Interface’s annualized revenue growth of 6.4% over the last two years aligns with its five-year trend, suggesting its demand was stable. 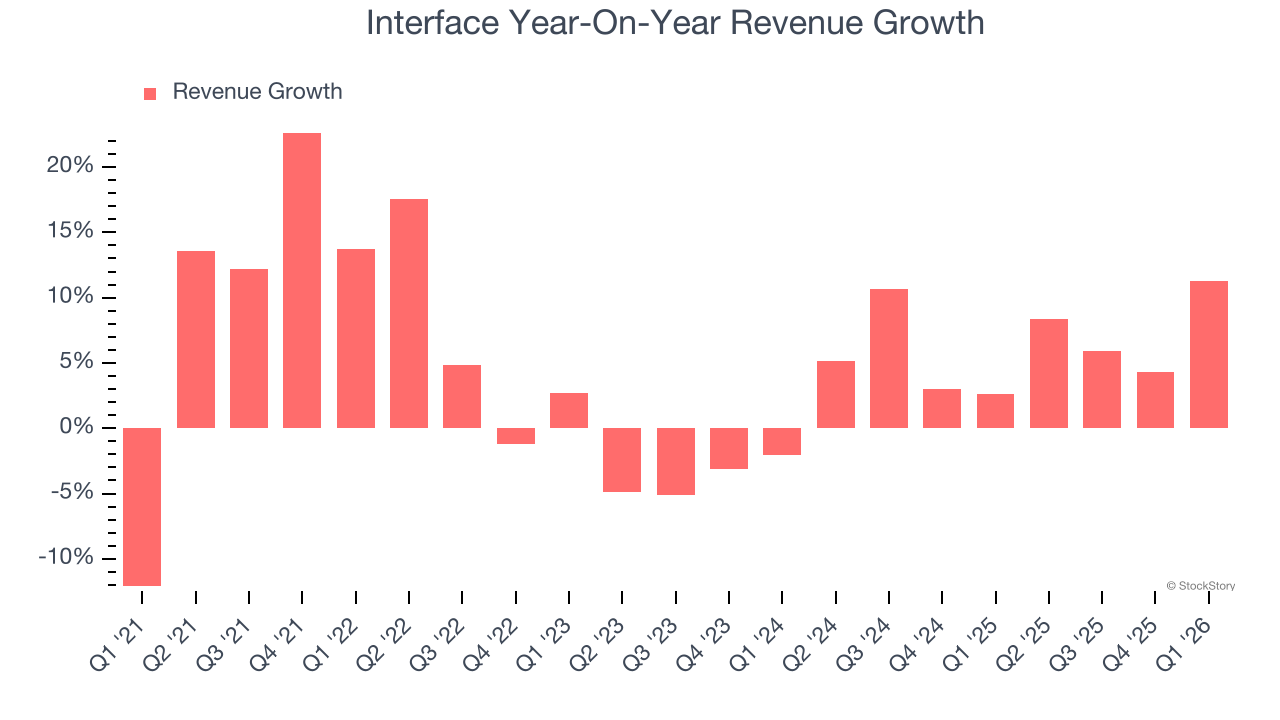
This quarter, Interface reported year-on-year revenue growth of 11.3%, and its $331 million of revenue exceeded Wall Street’s estimates by 3.5%. Company management is currently guiding for a 3.9% year-on-year increase in sales next quarter.
Looking further ahead, sell-side analysts expect revenue to grow 3.4% over the next 12 months, a slight deceleration versus the last two years. This projection doesn't excite us and indicates its products and services will see some demand headwinds. At least the company is tracking well in other measures of financial health.
ALSO WORTH WATCHING: Nvidia’s Quiet Partner. Nvidia’s chips cost a hundred grand. The connectors that make them work cost even more. One company makes them all.
Every AI server needs specialized infrastructure the chip companies don’t make. High-speed cables. Power connectors. Thermal sensors. This 90-year-old company built a monopoly on it. The AI boom just started. This stock is still flying under the radar. Claim The Stock Ticker Here for FREE.
Adjusted Operating Margin
Adjusted operating margin is one of the best measures of profitability because it tells us how much money a company takes home after subtracting all core expenses, like marketing and R&D. It also removes various one-time costs to paint a better picture of normalized profits.
Interface has done a decent job managing its cost base over the last five years. The company has produced an average adjusted operating margin of 10.7%, higher than the broader business services sector.
Analyzing the trend in its profitability, Interface’s adjusted operating margin rose by 1.9 percentage points over the last five years, as its sales growth gave it operating leverage.

This quarter, Interface generated an adjusted operating margin profit margin of 9.8%, up 1.2 percentage points year on year. This increase was a welcome development and shows it was more efficient.
Earnings Per Share
Revenue trends explain a company’s historical growth, but the long-term change in earnings per share (EPS) points to the profitability of that growth – for example, a company could inflate its sales through excessive spending on advertising and promotions.
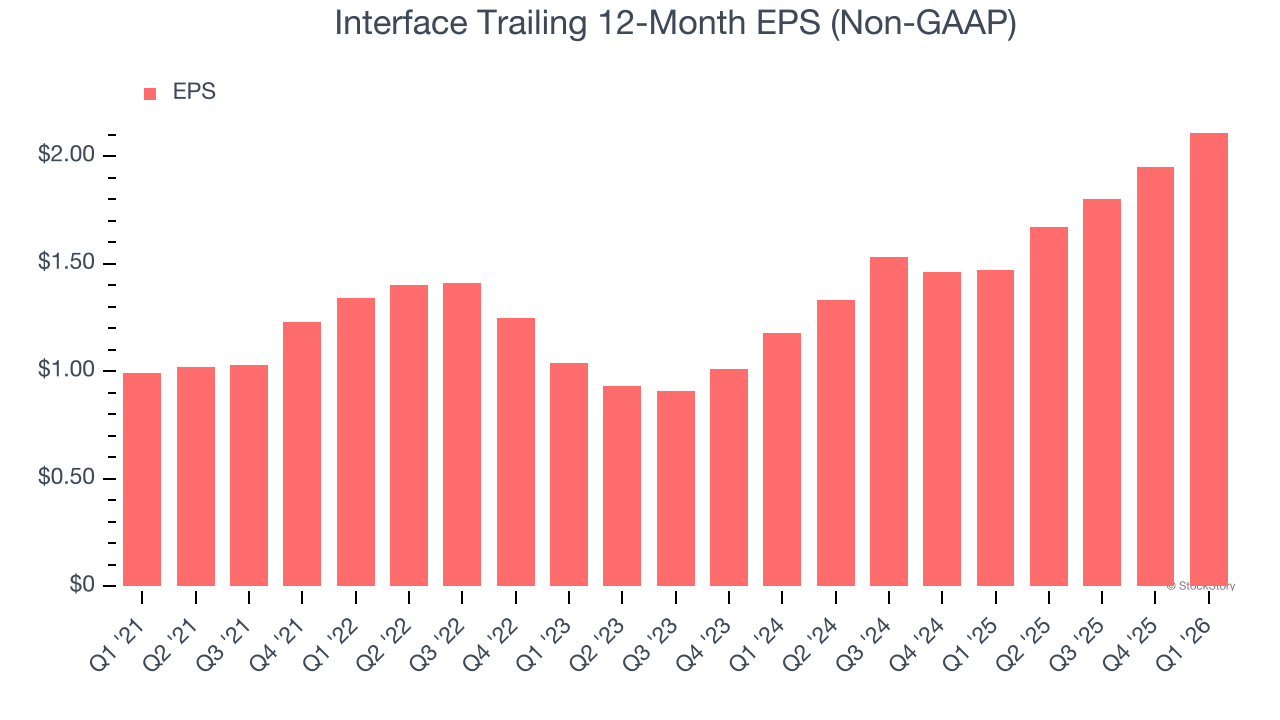
Interface’s EPS grew at 16.3% compounded annual growth rate over the last five years, higher than its 5.9% annualized revenue growth. This tells us the company became more profitable on a per-share basis as it expanded.
Diving into Interface’s quality of earnings can give us a better understanding of its performance. As we mentioned earlier, Interface’s adjusted operating margin expanded by 1.9 percentage points over the last five years. This was the most relevant factor (aside from the revenue impact) behind its higher earnings; interest expenses and taxes can also affect EPS but don’t tell us as much about a company’s fundamentals.
Like with revenue, we analyze EPS over a shorter period to see if we are missing a change in the business.
For Interface, its two-year annual EPS growth of 33.7% was higher than its five-year trend. We love it when earnings growth accelerates, especially when it accelerates off an already high base.
In Q1, Interface reported adjusted EPS of $0.41, up from $0.25 in the same quarter last year. This print easily cleared analysts’ estimates, and shareholders should be content with the results. We also like to analyze expected EPS growth based on Wall Street analysts’ consensus projections, but there is insufficient data.
Key Takeaways from Interface’s Q1 Results
It was good to see Interface beat analysts’ EPS expectations this quarter. We were also glad its revenue outperformed Wall Street’s estimates. Overall, we think this was a decent quarter with some key metrics above expectations. The stock traded up 5.5% to $29.07 immediately after reporting.
Indeed, Interface had a rock-solid quarterly earnings result, but is this stock a good investment here? What happened in the latest quarter matters, but not as much as longer-term business quality and valuation, when deciding whether to invest in this stock. We cover that in our actionable full research report which you can read here (it’s free).


