
Workplace furnishings manufacturer HNI Corporation (NYSE: HNI) reported revenue ahead of Wall Street’s expectations in Q4 CY2025, with sales up 38.3% year on year to $888.4 million. Its non-GAAP profit of $0.83 per share was 8.8% below analysts’ consensus estimates.
Is now the time to buy HNI? Find out by accessing our full research report, it’s free.
HNI (HNI) Q4 CY2025 Highlights:
- Revenue: $888.4 million vs analyst estimates of $697.5 million (38.3% year-on-year growth, 27.4% beat)
- Adjusted EPS: $0.83 vs analyst expectations of $0.91 (8.8% miss)
- Operating Margin: -3.5%, down from 9.6% in the same quarter last year
- Free Cash Flow Margin: 1.9%, down from 6.5% in the same quarter last year
- Market Capitalization: $3.45 billion
Company Overview
With roots dating back to 1944 and a significant acquisition of Kimball International in 2023, HNI (NYSE: HNI) manufactures and sells office furniture systems, seating, and storage solutions, as well as residential fireplaces and heating products.
Revenue Growth
A company’s long-term sales performance is one signal of its overall quality. Any business can experience short-term success, but top-performing ones enjoy sustained growth for years.
With $2.84 billion in revenue over the past 12 months, HNI is a mid-sized business services company, which sometimes brings disadvantages compared to larger competitors benefiting from better economies of scale. On the bright side, it can still flex high growth rates because it’s working from a smaller revenue base.
As you can see below, HNI’s sales grew at a solid 7.7% compounded annual growth rate over the last five years. This shows it had high demand, a useful starting point for our analysis.
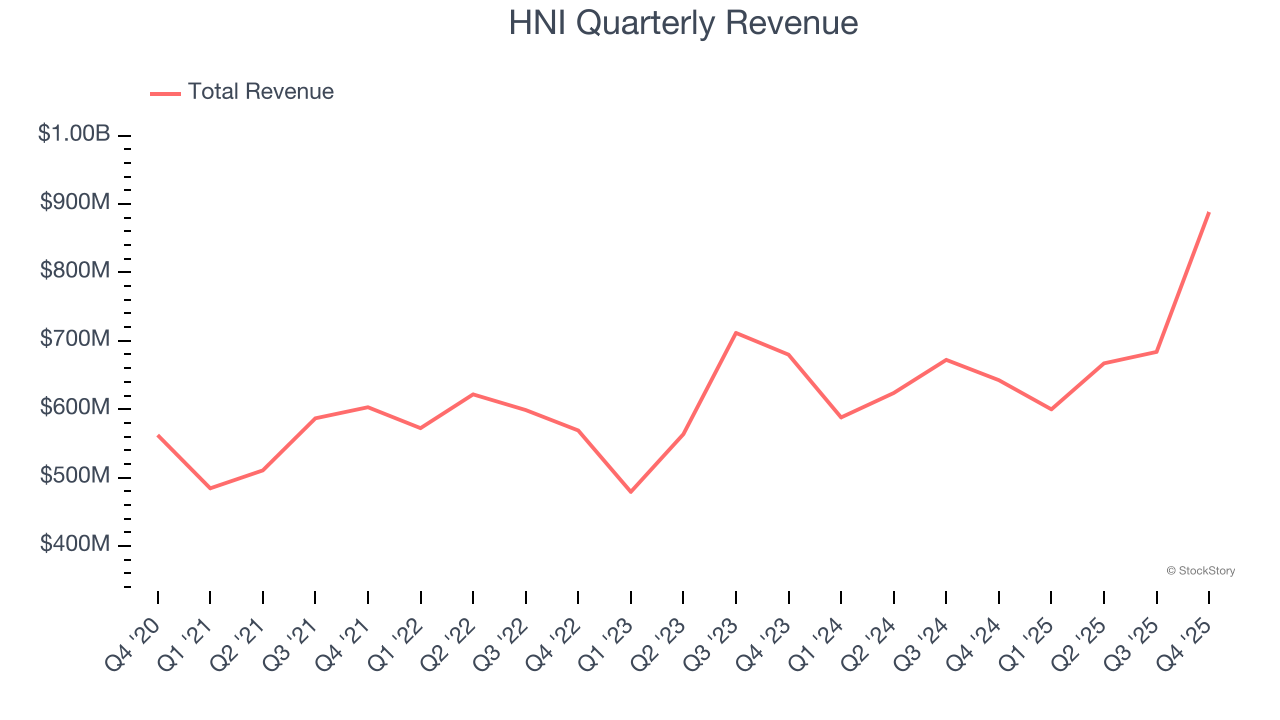
Long-term growth is the most important, but within business services, a half-decade historical view may miss new innovations or demand cycles. HNI’s annualized revenue growth of 8% over the last two years aligns with its five-year trend, suggesting its demand was predictably strong. 
This quarter, HNI reported wonderful year-on-year revenue growth of 38.3%, and its $888.4 million of revenue exceeded Wall Street’s estimates by 27.4%.
Looking ahead, sell-side analysts expect revenue to decline by 1.1% over the next 12 months, a deceleration versus the last two years. This projection is underwhelming and suggests its products and services will face some demand challenges. At least the company is tracking well in other measures of financial health.
The 1999 book Gorilla Game predicted Microsoft and Apple would dominate tech before it happened. Its thesis? Identify the platform winners early. Today, enterprise software companies embedding generative AI are becoming the new gorillas. a profitable, fast-growing enterprise software stock that is already riding the automation wave and looking to catch the generative AI next.
Operating Margin
Operating margin is a key measure of profitability. Think of it as net income - the bottom line - excluding the impact of taxes and interest on debt, which are less connected to business fundamentals.
HNI’s operating margin might fluctuated slightly over the last 12 months but has remained more or less the same, averaging 6.2% over the last five years. This profitability was paltry for a business services business and caused by its suboptimal cost structure.
Looking at the trend in its profitability, HNI’s operating margin might fluctuated slightly but has generally stayed the same over the last five years. This raises questions about the company’s expense base because its revenue growth should have given it leverage on its fixed costs, resulting in better economies of scale and profitability.
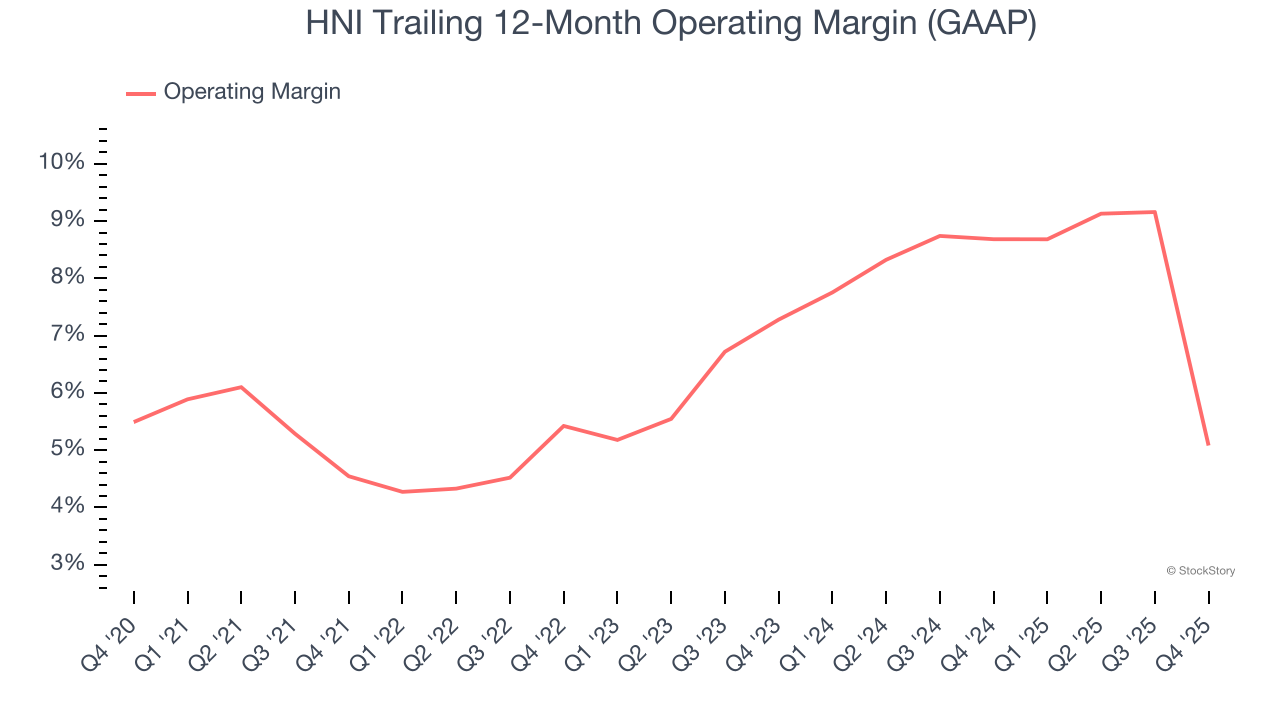
This quarter, HNI generated an operating margin profit margin of negative 3.5%, down 13.2 percentage points year on year. This contraction shows it was less efficient because its expenses grew faster than its revenue.
Earnings Per Share
We track the long-term change in earnings per share (EPS) for the same reason as long-term revenue growth. Compared to revenue, however, EPS highlights whether a company’s growth is profitable.
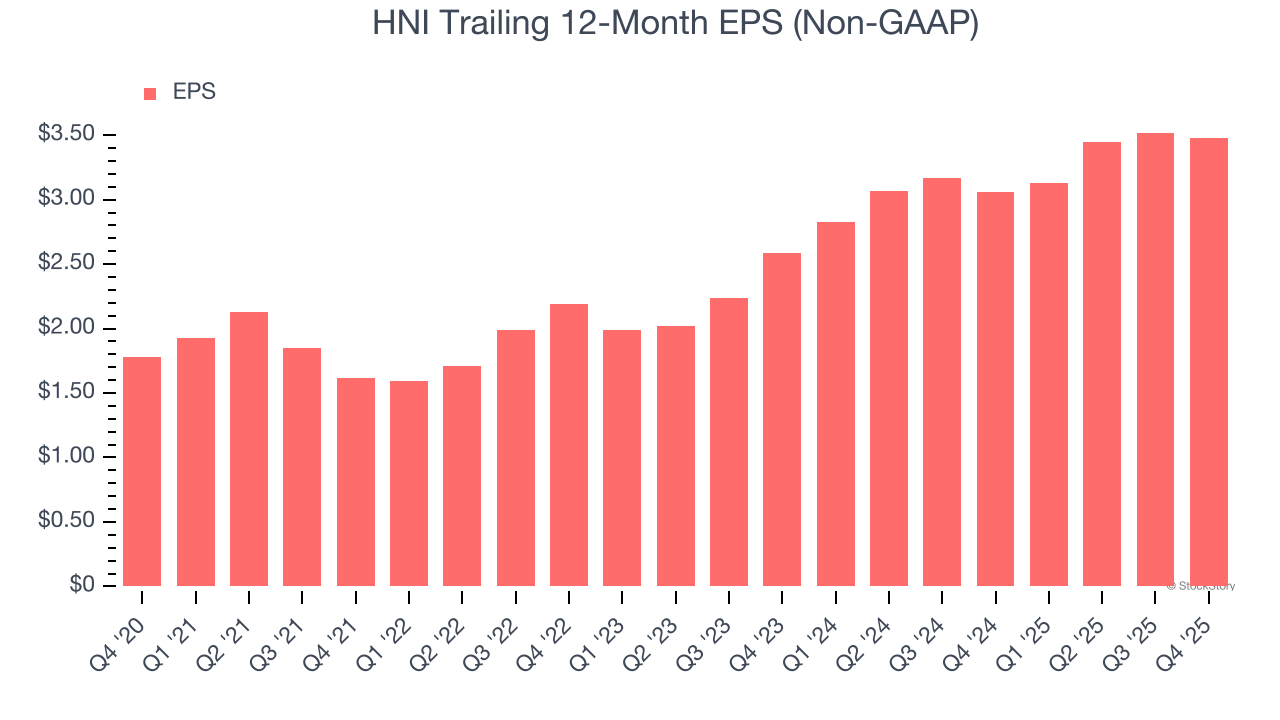
HNI’s EPS grew at a spectacular 14.3% compounded annual growth rate over the last five years, higher than its 7.7% annualized revenue growth. However, we take this with a grain of salt because its operating margin didn’t improve and it didn’t repurchase its shares, meaning the delta came from reduced interest expenses or taxes.
Like with revenue, we analyze EPS over a more recent period because it can provide insight into an emerging theme or development for the business.
For HNI, its two-year annual EPS growth of 15.9% was higher than its five-year trend. We love it when earnings growth accelerates, especially when it accelerates off an already high base.
In Q4, HNI reported adjusted EPS of $0.83, down from $0.87 in the same quarter last year. This print missed analysts’ estimates, but we care more about long-term adjusted EPS growth than short-term movements. Over the next 12 months, Wall Street expects HNI’s full-year EPS of $3.48 to grow 16.7%.
Key Takeaways from HNI’s Q4 Results
We were impressed by how significantly HNI blew past analysts’ revenue expectations this quarter. On the other hand, its EPS missed. Overall, this was a weaker quarter. The stock remained flat at $48.53 immediately after reporting.
HNI’s earnings report left more to be desired. Let’s look forward to see if this quarter has created an opportunity to buy the stock. What happened in the latest quarter matters, but not as much as longer-term business quality and valuation, when deciding whether to invest in this stock. We cover that in our actionable full research report which you can read here (it’s free).