

Industrial processing equipment and solutions provider Hillenbrand (NYSE: HI) reported Q3 CY2025 results exceeding the market’s revenue expectations, but sales fell by 22.1% year on year to $652.1 million. Its non-GAAP profit of $0.83 per share was 36.1% above analysts’ consensus estimates. As announced on October 15, 2025, Hillenbrand has entered into a definitive agreement to be acquired by an affiliate of Lone Star Funds ("Lone Star") in an all-cash transaction that equates to an enterprise value of approximately $3.8 billion.
Is now the time to buy Hillenbrand? Find out by accessing our full research report, it’s free for active Edge members.
Hillenbrand (HI) Q3 CY2025 Highlights:
- Revenue: $652.1 million vs analyst estimates of $594.1 million (22.1% year-on-year decline, 9.8% beat)
- Adjusted EPS: $0.83 vs analyst estimates of $0.61 (36.1% beat)
- Adjusted EBITDA: $107.9 million vs analyst estimates of $96.77 million (16.5% margin, 11.5% beat)
- Operating Margin: 12.3%, down from 14.4% in the same quarter last year
- Backlog: $1.57 billion at quarter end
- Market Capitalization: $2.23 billion
"Our teams delivered strong results in the fourth quarter, underpinned by focused execution of our strategic initiatives amid the evolving macroeconomic backdrop," said Kim Ryan, President and Chief Executive Officer of Hillenbrand.
Company Overview
Hillenbrand, Inc. (NYSE: HI) is an industrial company that designs, manufactures, and sells highly engineered processing equipment and solutions for various industries.
Revenue Growth
Reviewing a company’s long-term sales performance reveals insights into its quality. Any business can have short-term success, but a top-tier one grows for years. Regrettably, Hillenbrand’s sales grew at a weak 1.2% compounded annual growth rate over the last five years. This fell short of our benchmarks and is a tough starting point for our analysis.
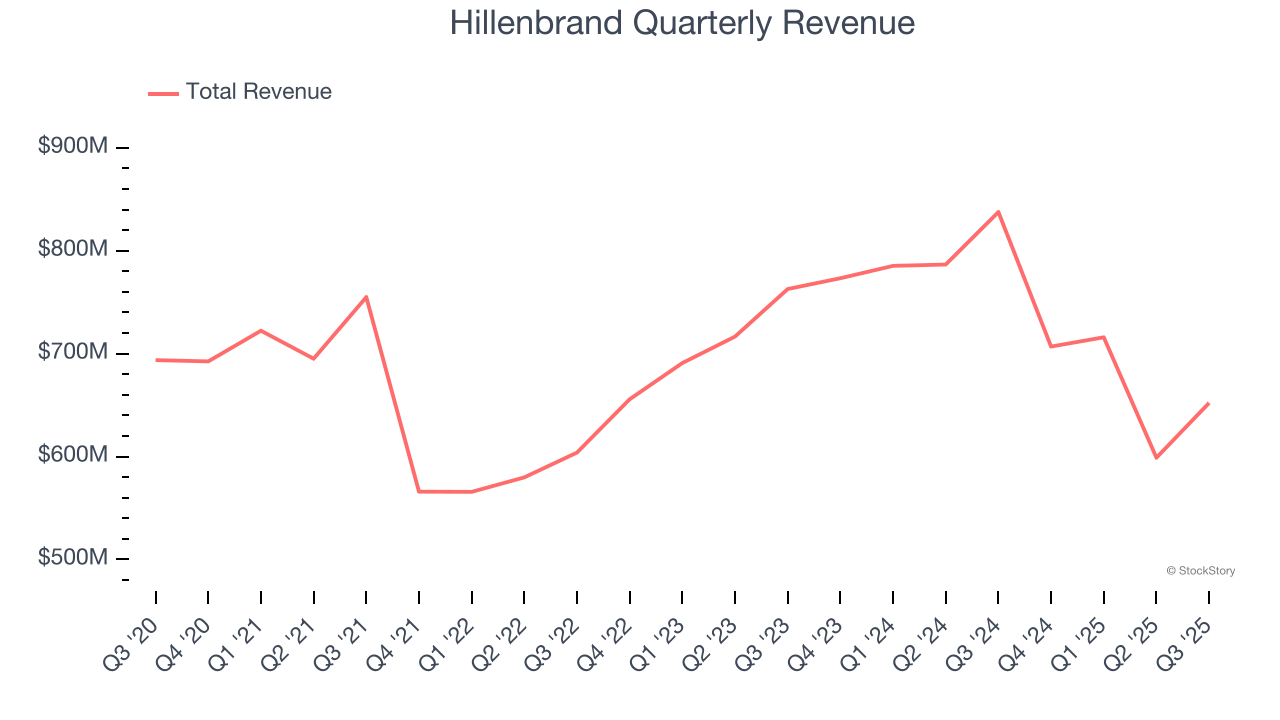
We at StockStory place the most emphasis on long-term growth, but within industrials, a half-decade historical view may miss cycles, industry trends, or a company capitalizing on catalysts such as a new contract win or a successful product line. Hillenbrand’s performance shows it grew in the past but relinquished its gains over the last two years, as its revenue fell by 2.7% annually. 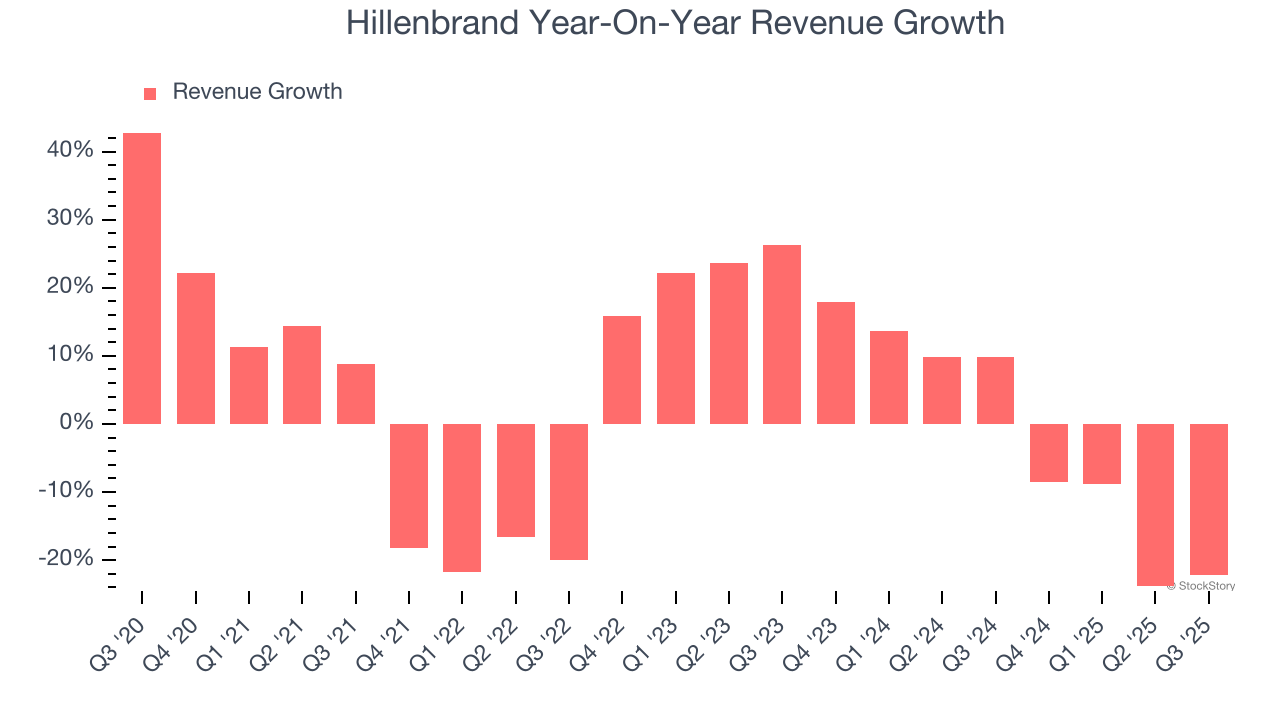
This quarter, Hillenbrand’s revenue fell by 22.1% year on year to $652.1 million but beat Wall Street’s estimates by 9.8%.
Looking ahead, sell-side analysts expect revenue to decline by 7.5% over the next 12 months, a deceleration versus the last two years. This projection is underwhelming and suggests its products and services will face some demand challenges.
Microsoft, Alphabet, Coca-Cola, Monster Beverage—all began as under-the-radar growth stories riding a massive trend. We’ve identified the next one: a profitable AI semiconductor play Wall Street is still overlooking. Go here for access to our full report.
Operating Margin
Hillenbrand has been an efficient company over the last five years. It was one of the more profitable businesses in the industrials sector, boasting an average operating margin of 12.4%. This result isn’t too surprising as its gross margin gives it a favorable starting point.
Analyzing the trend in its profitability, Hillenbrand’s operating margin decreased by 5.5 percentage points over the last five years. This raises questions about the company’s expense base because its revenue growth should have given it leverage on its fixed costs, resulting in better economies of scale and profitability.
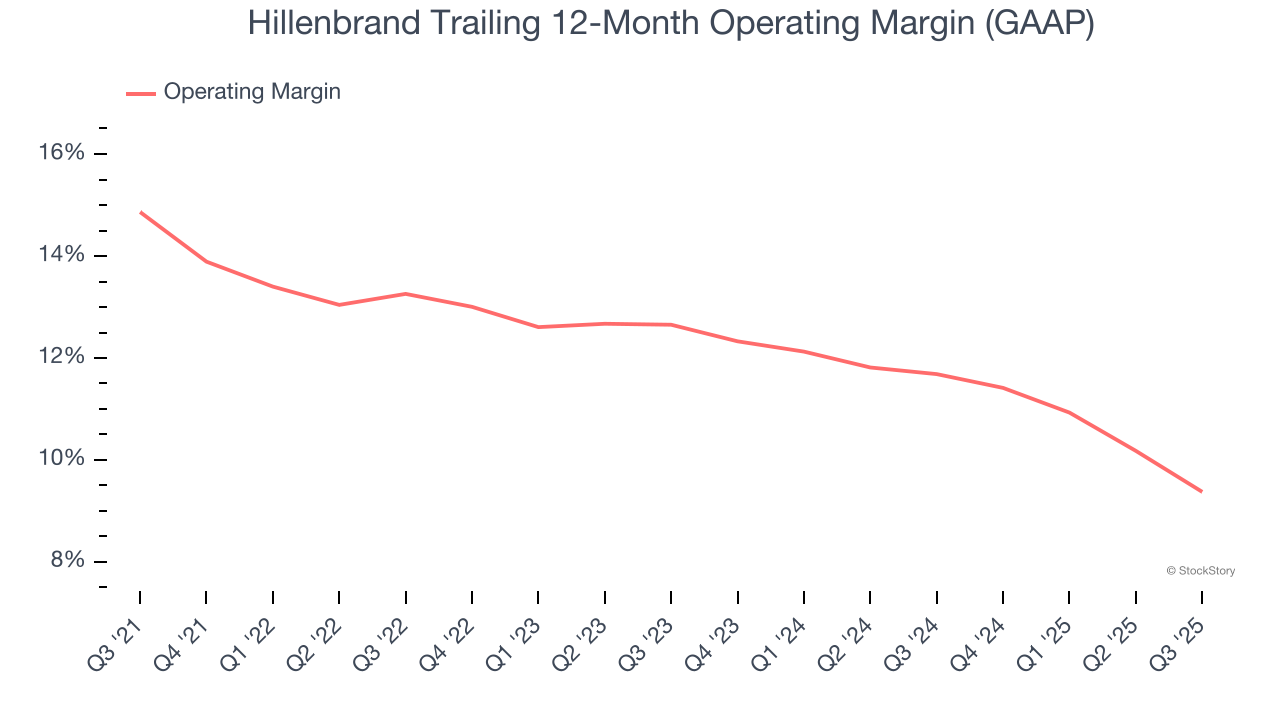
This quarter, Hillenbrand generated an operating margin profit margin of 12.3%, down 2.1 percentage points year on year. Since Hillenbrand’s operating margin decreased more than its gross margin, we can assume it was less efficient because expenses such as marketing, R&D, and administrative overhead increased.
Earnings Per Share
We track the long-term change in earnings per share (EPS) for the same reason as long-term revenue growth. Compared to revenue, however, EPS highlights whether a company’s growth is profitable.
Hillenbrand’s flat EPS over the last five years was below its 1.2% annualized revenue growth. This tells us the company became less profitable on a per-share basis as it expanded due to non-fundamental factors such as interest expenses and taxes.
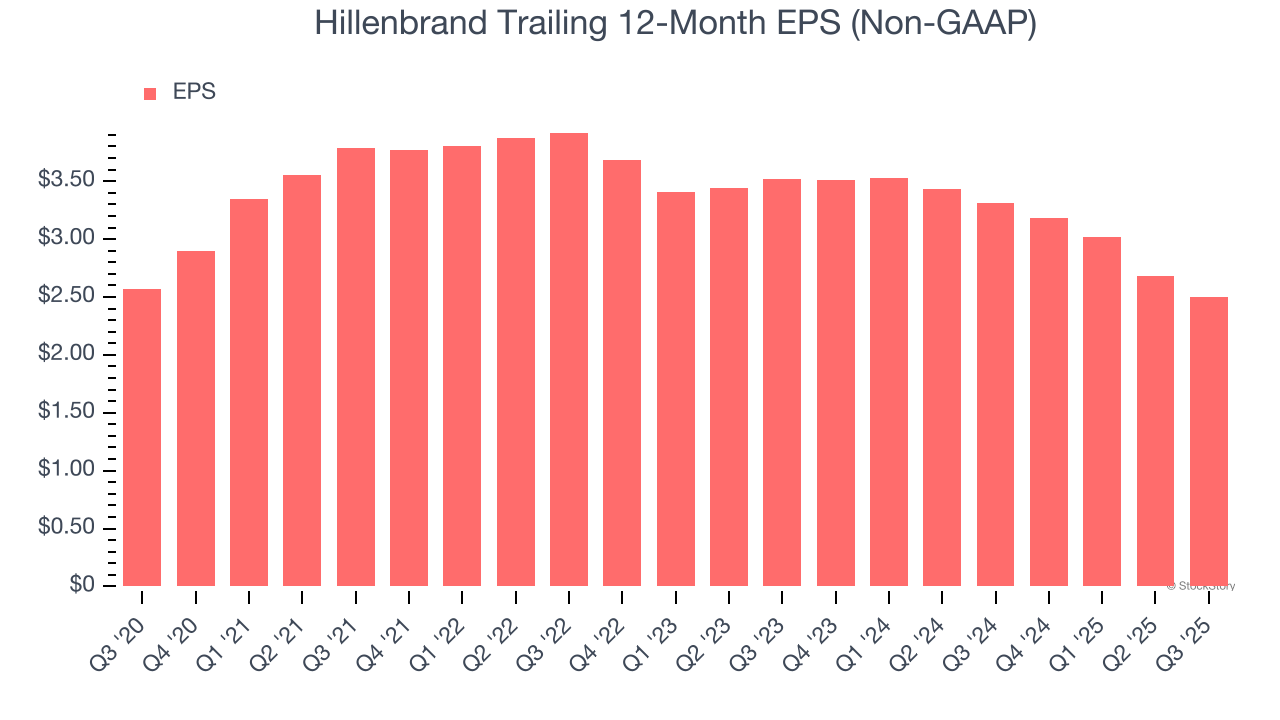
Like with revenue, we analyze EPS over a shorter period to see if we are missing a change in the business.
Hillenbrand’s two-year annual EPS declines of 15.7% were bad and lower than its two-year revenue losses.
Diving into the nuances of Hillenbrand’s earnings can give us a better understanding of its performance. Hillenbrand’s operating margin has declined over the last two years. This was the most relevant factor (aside from the revenue impact) behind its lower earnings; interest expenses and taxes can also affect EPS but don’t tell us as much about a company’s fundamentals.
In Q3, Hillenbrand reported adjusted EPS of $0.83, down from $1.01 in the same quarter last year. Despite falling year on year, this print easily cleared analysts’ estimates. Over the next 12 months, Wall Street expects Hillenbrand’s full-year EPS of $2.50 to grow 2.8%.
Key Takeaways from Hillenbrand’s Q3 Results
It was good to see Hillenbrand beat analysts’ EPS expectations this quarter. We were also excited its EBITDA outperformed Wall Street’s estimates by a wide margin. Zooming out, we think this was a good print with some key areas of upside. The stock remained flat at $31.64 immediately following the results.
Big picture, is Hillenbrand a buy here and now? We think that the latest quarter is only one piece of the longer-term business quality puzzle. Quality, when combined with valuation, can help determine if the stock is a buy. We cover that in our actionable full research report which you can read here, it’s free for active Edge members.


