

Television broadcasting and production company AMC Networks (NASDAQ: AMCX) met Wall Street’s revenue expectations in Q1 CY2026, but sales fell by 2.4% year on year to $542.1 million. Its non-GAAP profit of $0.08 per share was 62.3% below analysts’ consensus estimates.
Is now the time to buy AMC Networks? Find out by accessing our full research report, it’s free.
AMC Networks (AMCX) Q1 CY2026 Highlights:
- Revenue: $542.1 million vs analyst estimates of $540.9 million (2.4% year-on-year decline, in line)
- Adjusted EPS: $0.08 vs analyst expectations of $0.21 (62.3% miss)
- Adjusted EBITDA: $58.78 million vs analyst estimates of $57.19 million (10.8% margin, 2.8% beat)
- Operating Margin: 5.8%, down from 11.6% in the same quarter last year
- Free Cash Flow Margin: 12%, down from 17% in the same quarter last year
- Market Capitalization: $365.6 million
Chief Executive Officer Kristin Dolan said: "AMC Global Media delivered another quarter of double-digit streaming revenue growth and robust free cash flow generation. We are tracking to plan across all key metrics and are pleased to reiterate our financial outlook for the year. During this changing time in media, we continue to follow our own differentiated playbook as a studio-driven owner of world-class IP, fully distributed across a wide range of owned and partner platforms."
Company Overview
Originally the joint-venture of four cable television companies, AMC Networks (NASDAQ: AMCX) is a broadcaster producing a diverse range of television shows and movies.
Revenue Growth
A company’s long-term performance is an indicator of its overall quality. Even a bad business can shine for one or two quarters, but a top-tier one grows for years. AMC Networks struggled to consistently generate demand over the last five years as its sales dropped at a 3.7% annual rate. This was below our standards and is a sign of poor business quality.
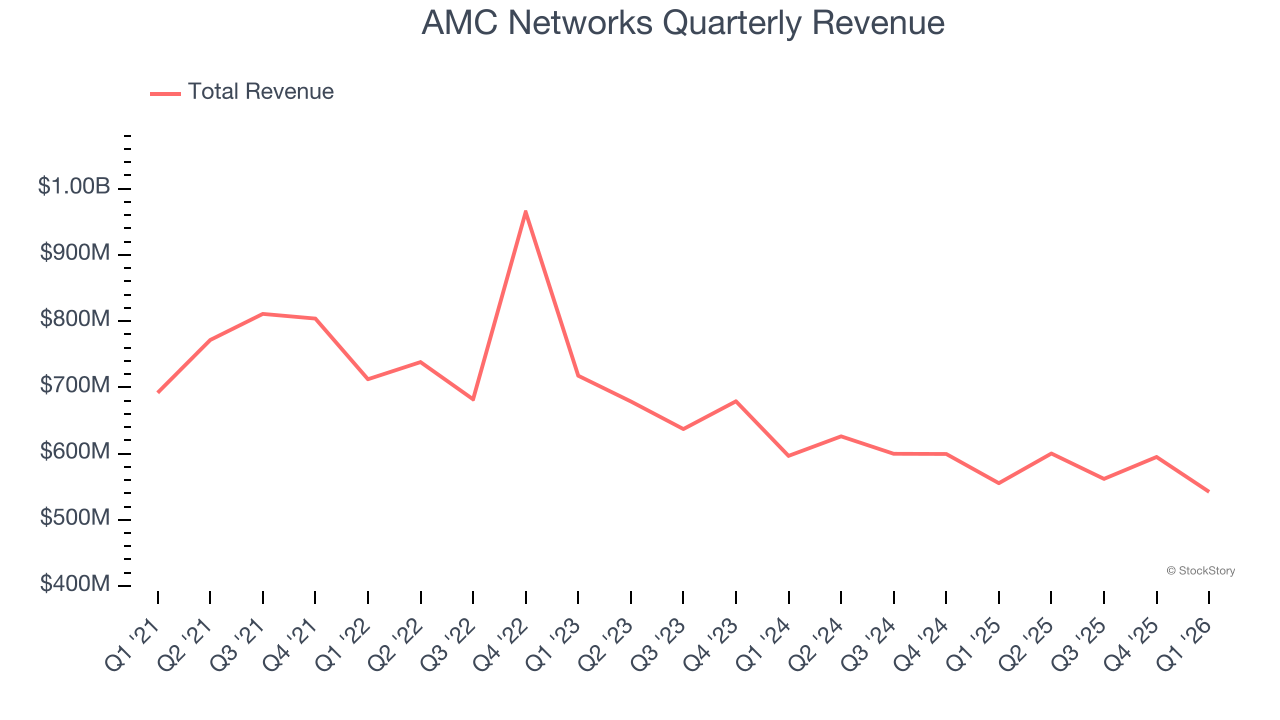
Long-term growth is the most important, but within consumer discretionary, product cycles are short and revenue can be hit-driven due to rapidly changing trends and consumer preferences. AMC Networks’s recent performance shows its demand remained suppressed as its revenue has declined by 5.8% annually over the last two years. 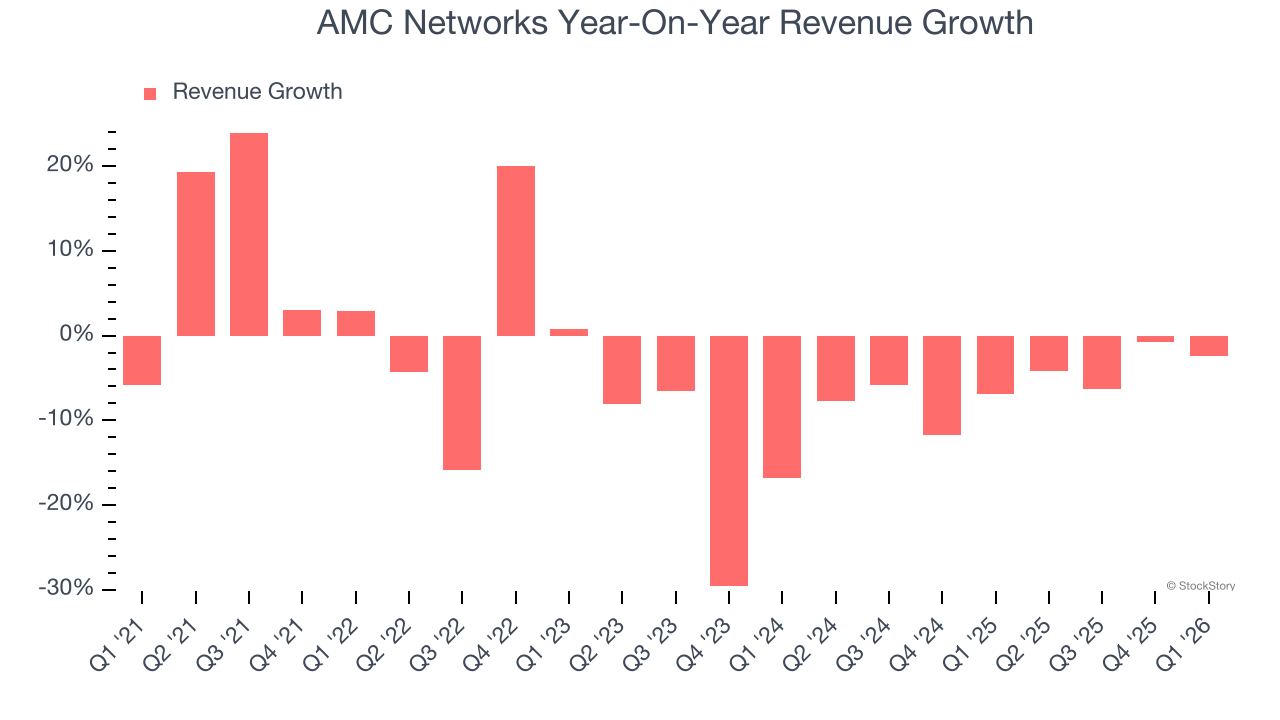
We can dig further into the company’s revenue dynamics by analyzing its most important segments, Affiliate and Advertising, which are 32.1% and 24.2% of revenue. Over the last two years, AMC Networks’s Affiliate revenue (retransmission and licensing fees) averaged 14.1% year-on-year declines while its Advertising revenue (marketing services) was flat. 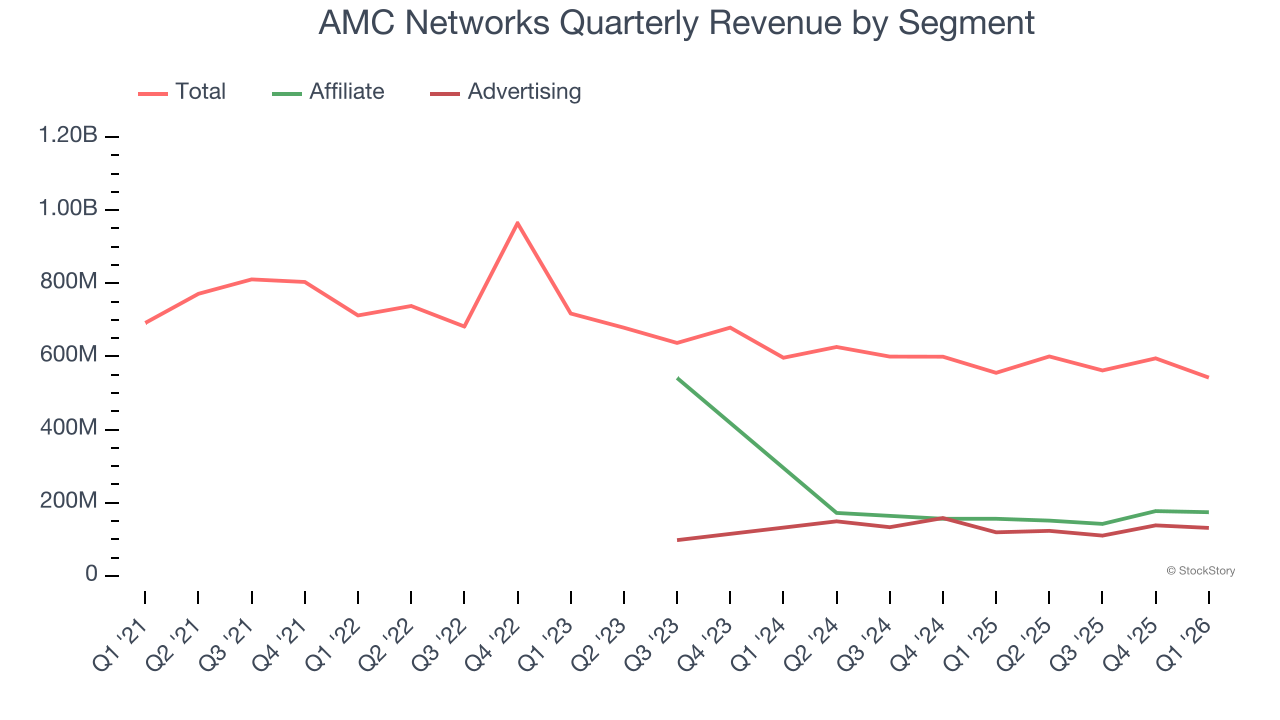
This quarter, AMC Networks reported a rather uninspiring 2.4% year-on-year revenue decline to $542.1 million of revenue, in line with Wall Street’s estimates.
Looking ahead, sell-side analysts expect revenue to decline by 2.8% over the next 12 months. Although this projection is better than its two-year trend, it’s hard to get excited about a company that is struggling with demand.
ONE MORE THING: 3 Hidden Platforms Growing 3X Faster than Amazon, Google, and PayPal. Amazon, Google, and Meta all followed the same playbook: Dominate an ignored market. Build an unbeatable moat. Scale until you’re unstoppable.
These three platforms are running that exact playbook right now. The early investors in Amazon made fortunes. The early investors in these could do the same. Get All 3 Stocks Here for FREE.
Operating Margin
AMC Networks’s operating margin has risen over the last 12 months, leading to break even profits over the last two years. However, its large expense base and inefficient cost structure mean it still sports inadequate profitability for a consumer discretionary business.
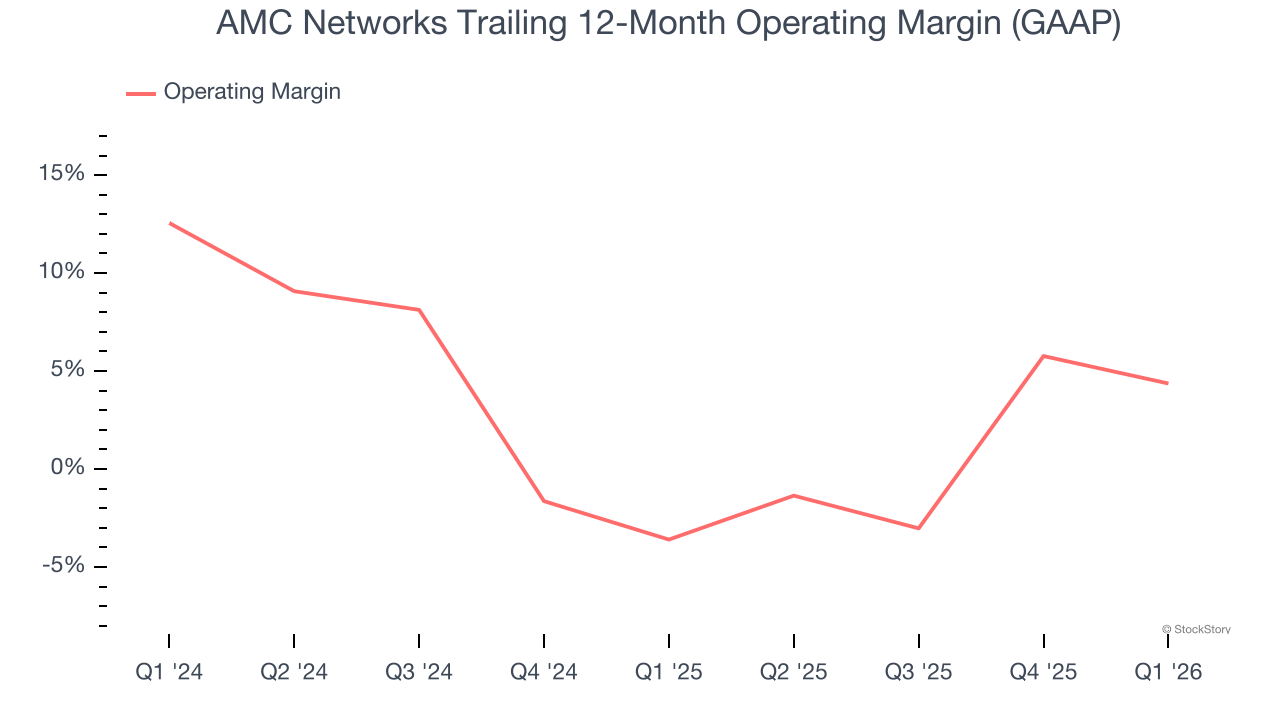
In Q1, AMC Networks generated an operating margin profit margin of 5.8%, down 5.8 percentage points year on year. This contraction shows it was less efficient because its expenses increased relative to its revenue.
Earnings Per Share
We track the long-term change in earnings per share (EPS) for the same reason as long-term revenue growth. Compared to revenue, however, EPS highlights whether a company’s growth is profitable.
Sadly for AMC Networks, its EPS declined by 29.9% annually over the last five years, more than its revenue. This tells us the company struggled because its fixed cost base made it difficult to adjust to shrinking demand.
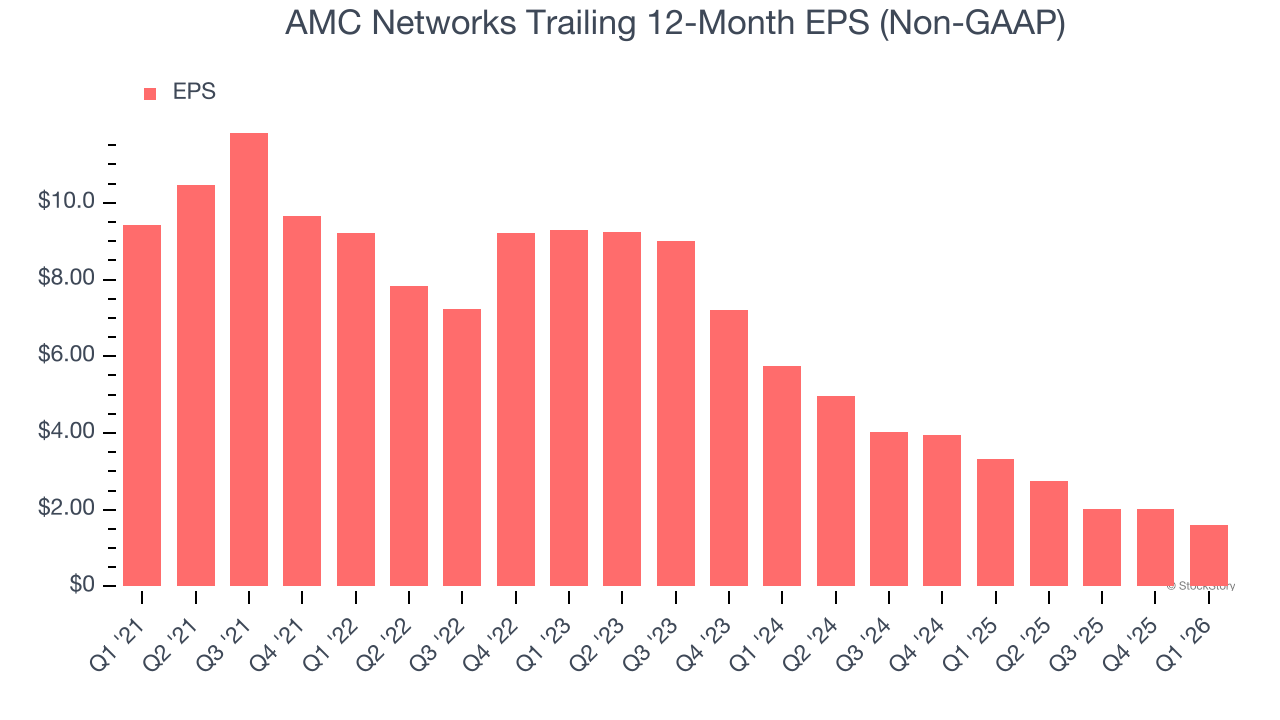
In Q1, AMC Networks reported adjusted EPS of $0.08, down from $0.52 in the same quarter last year. This print missed analysts’ estimates. We also like to analyze expected EPS growth based on Wall Street analysts’ consensus projections, but there is insufficient data.
Key Takeaways from AMC Networks’s Q1 Results
It was encouraging to see AMC Networks beat analysts’ EBITDA expectations this quarter. On the other hand, its EPS missed and its adjusted operating income fell short of Wall Street’s estimates. Overall, this was a weaker quarter. The stock traded down 2.3% to $8.37 immediately after reporting.
The latest quarter from AMC Networks’s wasn’t that good. One earnings report doesn’t define a company’s quality, though, so let’s explore whether the stock is a buy at the current price. If you’re making that decision, you should consider the bigger picture of valuation, business qualities, as well as the latest earnings. We cover that in our actionable full research report which you can read here (it’s free).


